Fact checked

At MarketMates, we are committed to providing accurate information. Our content undergoes a rigorous process of fact-checking before it is published. Learn more about our editorial policy.
Last updated on July 1st, 2025
  Written by 
MarketMates Editorial Team
The MarketMates editorial team is led by ceo and co-founder Sam Eder, and consists of internal and external trading experts.
Our authors
  Reviewed by 
Sam Eder

Reviewer

Sam Eder
Sam is the cofounder and CEO of MarketMates. He has worked for brokers since 2008 and is the author of the Amazon best-seller 'The Consistent Trader.' His 'Advanced Forex Course for Smart Traders' has over 45,000 students.
Our authors

Forex 101: What is Market Volatility?

A beginner's guide to market volatility, what it means to traders and how to measure it

5 ChatGPT Prompts to Help You Pass Any Prop Firm Challenge

Build a rules-based plan in minutes using AI.

In this article

Secure Broker-backed Funding for Traders.

Try simple, flexible ‘balance-based’ challenges. 

MarketMates Logo

The MarketMates promise

At MarketMates, we are committed to providing accurate information. Our content undergoes a rigorous process of fact-checking before it is published. Learn more about our editorial policy.

In this article

Volatility measures how much the value of something goes up and down over a certain period of time.

In this guide, we explain what volatility is, how to measure it, and why it matters for your trading.

Why market volatility is a trader’s friend

Traders need the markets to move to generate trading opportunities, so they often prefer high-volatility conditions.

If the markets remain flat (i.e. low volatility) it can lead to conditions where traders are continually frustrated by the lack of movement.

However, higher volatility may also mean higher risk, and the need to get in and out of trades quickly, and highly volatile conditions are not always preferable.

Steady volatility is best for beginners

Some financial instruments are quite stable, with only gentle price movements up and down over the course of a day or a week.

These are known as stable assets.

Trading stable assets is the best place for beginner traders to learn how to trade, before they graduate onto more volatile instruments.

The price of other financial assets can move quite violently up and down in a short space of time, so they are known as volatile assets.

For example, cryptocurrency is known to be a very volatile asset, as there can be a great deal of price movement in a short space of time.

Here’s an example of extreme volatility. On the Bitcoin/USD price chart example below, showing a five-day period on an hourly chart, the price ranges from around USD $64,000 to over USD $70,000 in a week.

This is NOT the sort of volatility that beginner traders should learn with!

A trading chart showing Bitcoin price in USD to illustrate extreme volatility

Which forex pairs are most volatile?

While understanding volatility is important across different asset classes, let’s look at an example comparing forex pairs.

When it comes to trading forex, the major pairs are less volatile than exotic pairs, because they are traded very heavily, so daily volume is very high.

Exotic pairs are traded far less often than the major currencies.

For example, the most highly-traded major pair is EUR/USD, the Euro vs the US dollar.

The large volume traded means that EUR/USD is considered more liquid and stable.

GBP/PLN (British Pound/Polish Zloty) is considered a volatile exotic pair, as there is less volume of this currency pair traded.

Because of the limited volume, the pair can be subject to rapid price movements.

This could be because large orders are placed in the market or because of fundamental factors such as political instability.  You can find out more about price ranges and how the forex market works here.

Here are examples of a stable major pair, a slightly more volatile minor pair, and a highly volatile exotic pair

A stable major currency pair – EUR/USD (Euro/US Dollar).

See how on this daily chart, the currency price only ranges 200-300 pips for the entire three-month period?

A trading chart showing a three-month period of very low volatility with short candlesticks


A slightly more volatile minor pair – AUD/USD (Australian Dollar/US Dollar)

The volatility is slightly higher, around 500 pips over the three-month period.

A trading chart showing candlesticks in a medium volatility pattern using the AUDUSD pair as an example


A highly volatile exotic currency pair – GBP/PLN (British Pound/Polish Zloty)

See how the price candlesticks are much taller, with the price moving around 2,000 pips in the same three-month period?

A trading chart showing candlesticks in a high volatility pattern using the GBPPLN pair as an example

Most volatile exotic pairs

The most volatile exotic pairs are:

  • USD/TRY (US Dollar vs. Turkish Lira)
  • USD/MXN (US Dollar vs. Mexican Peso)
  • USD/ZAR (US Dollar vs. South African Rand)
  • EUR/RUB (Euro vs. Russian Ruble)

Trading these pairs is best left to experienced or specialised traders who focus on trading exotic currency pairs.

Most stable major pairs

The most stable major pairs that beginners can learn to trade with include:

  • EUR/USD (Euro vs. US Dollar)
  • USD/JPY (US Dollar vs. Japanese Yen)
  • GBP/USD (British Pound vs. US Dollar)

It is worth noting that even these pairs are subject to periods of high volatility. This could be because of a major news event, or other fundamental factors. 

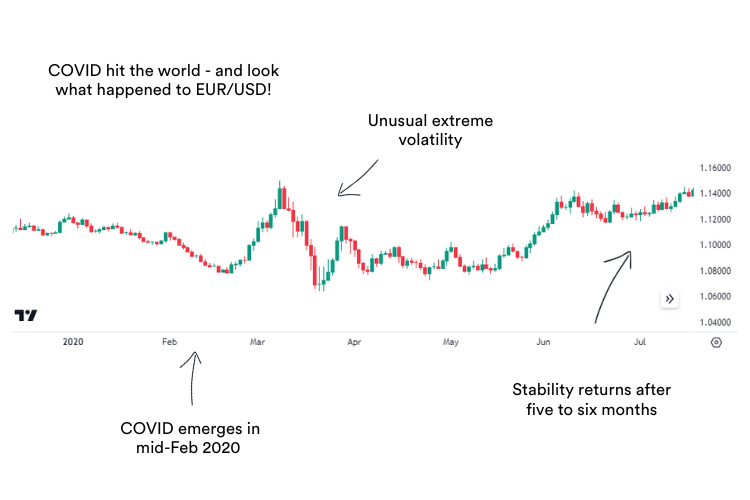
For example, the Euro/USD is normally a very stable currency. It’s daily chart usually looks something like this: 

A trading chart showing candlesticks in a very stable pattern respecting support and resistance

See how it usually moves within a narrow price band of around two cents?

Then, in early 2020, COVID hit the world. See what the news event did to this usually stable currency pair?

A trading chart showing the effect of COVID on price action on a stable currency pair

How is volatility measured?

Volatility is measurable, and we can plot it on a price chart.

This enables us to see how volatile one asset is compared to another.

We measure volatility in percentage terms, by taking the distance from the asset’s low value of the day, to its highest peak of the day, compared to the asset’s price.

For example, if a $1 asset moves 10c from its highest price point to its lowest price point in one day, its volatility would be 10%, because its price has moved a tenth of its overall value in one day.

Standard deviation means the average amount an asset’s value differs from the mean over a set period of time.

Standard deviation is the most common way to measure market volatility, and traders often use Bollinger Bands to analyse standard deviation.

Using Bollinger Bands to measure volatility

Traders use an indicator tool called Bollinger Bands to measure volatility and look at how prices change over time.

The standard deviation is shown by the width of the Bollinger Bands. The wider the Bollinger Bands, the more volatile an asset’s price is within the given period.

Bollinger Bands have three lines: the simple moving average (SMA) in the middle, and then two bands placed one standard deviation above and below the SMA.

The SMA is like a smooth version of the asset’s past prices, but it doesn’t react quickly to change.

The outer Bollinger Bands move along with the asset’s price change, to show how much the price is deviating from the average.

  • If the Bollinger Bands are wide, it means the price is changing a lot.
  • If they’re narrow, it means the price isn’t changing much, so there is little volatility.
A trading chart with Bollinger Band indicator showing low and high volatility periods of price action

Using ATR to measure volatility

The Average True Range or ATR indicator is a useful tool for measuring volatility.

The ATR measures the price movement over a time period and gives you an average.

For example, the ATR could measure the average price of the last 50 candlesticks. 

If the ATR was 2,000, it would mean the average price movement was 200 pips over the last 50 candles.

By tracking the increases or decreases in the ATR over time, you can see the increases or decreases in volatility in an instrument.   

In this example, can you see how the ATR indicator rapidly increases on days when there is strong price movement, as shown by long candlesticks?

A trading chart showing candlestick price action and the ATR indicator

Why volatility is important to traders

Volatility is crucial because it directly affects trading decisions and strategies. Here’s why volatility matters:

  • Price movement: Volatility measures the degree of price fluctuation. Higher volatility means prices can change rapidly, providing more trading opportunities.
  • Risk management: Volatility influences the level of risk in trading. Higher volatility can lead to larger price swings, increasing the potential for both profits and losses.
  • Strategy selection: Different trading strategies perform better depending on the level of volatility. For instance, trend trading strategies often succeed in high-volatility environments.
  • Market conditions: Volatility reflects market sentiment and uncertainty. Sudden increases in volatility may signal significant news events or changes in investor sentiment.
  • Price prediction: Volatility can provide insights into future price movements. Historical volatility patterns may indicate potential breakouts or reversals in the market.

Price volatility is a key factor that traders take into account when deciding to place a trade.

It influences position size, stop-loss placement, entry and exit points, and other trading decisions, depending on your particular strategy.

What is ideal for beginner traders is a nice, gentle movement that goes up and down according to an easily-recognisable pattern. 

Unfortunately, life is rarely that easy or predictable!

What the forex trader is more likely to encounter is short periods of high volatility, followed by quiet periods with no price movement at all (a market condition known as consolidation.)

When I was teaching beginner traders, I advised them to learn to recognise and adapt to different levels of volatility to improve their trading performance.

I also advised them to stick to the major, stable currency pairs to avoid the possibility of extreme volatility catching them unawares.

However, as we have seen from the example of what happened to EUR/USD when COVID 19 hit the world, there is never any guarantee that a currency pair will behave as expected.

My mantra was always ‘expect the unexpected’ when trading – and be mentally prepared for any possibility!

On this page about trading in the zone, my colleague Sam Eder explains how to be mentally prepared for trading, and how to react when the unexpected happens.

Happy trading!  Till next time,

Cate Signature

If you like this article then sign-up for our newsletter or join over 42,000 traders and get The Advanced Forex Course for Smart Traders 2.0. It’s 100% free.

Sources

Marketmates uses only high-quality sources, including peer-reviewed studies, to support the facts within our articles. Read our editorial guidelines to learn more about how we fact-check and keep our content accurate, reliable, and trustworthy.

  1. Bollinger Bands – John Bollinger https://www.bollingerbands.com/
  2. Louise Bedford – The Secret of Candlestick Charting https://www.tradinggame.com.au/product/technical-analysis/the-secret-of-candlestick-charting
  3. J. Welles Wilder Jr – inventor of the ATR indicator in his book New Concepts in Technical Trading Systems  https://www.amazon.com.au/New-Concepts-Technical-Trading-Systems/

Secure Broker-backed Funding for Traders.

Try simple, flexible ‘balance-based’ challenges. 

Picture of MarketMates Editorial Team

MarketMates Editorial Team

The MarketMates editorial team is led by ceo and co-founder Sam Eder, and consists of internal and external trading experts.
Picture of MarketMates Editorial Team

MarketMates Editorial Team

The MarketMates editorial team is led by ceo and co-founder Sam Eder, and consists of internal and external trading experts.

5 ChatGPT Prompts to Help You Pass Any Prop Firm Challenge

Build a rules-based plan in minutes using AI.

The Advanced Forex Course

for Smart Traders 2.0

Join over 42,000 traders and get FREE access to 17+ lessons and five hours of on-demand video based on the famous ‘Market Wizards’.

Keep Learning

Bank Desk Weekly
Sam Eder

Bank Desk FX Weekly 24 August 26

The US dollar remains under pressure, but this week could decide whether the weakness has further to run. PCE inflation and Fed Chair Kevin Warsh at Jackson Hole are the

Bank Desk Weekly
Sam Eder

Bank Desk FX Weekly 17 August 26

The US dollar starts the week under pressure as weaker jobs, inflation and retail data reduce expectations for another Fed rate increase.

Bank Desk Weekly
Sam Eder

Bank Desk FX Weekly 10 August 26

Weak US jobs have pushed the dollar lower and reduced expectations for further Fed rate hikes. Banks remain divided on what comes next, with US CPI, the RBA decision and

marketmates

Join over 42,000 Traders. 100% FREE.

The Advanced Forex Course
for Smart Traders