Forex trend trading involves analysing the direction of price movement, and then trading in the direction the price is moving.
A trend trading strategy is a system or method that describes exactly how you are going to trade in the trend direction.
Therefore, understanding basic trend direction is crucial for developing a successful trend trading strategy.
This will enable you to identify potential trading opportunities to take advantage of the trend direction.
Here we’re going to look at different ways to identify trend direction, the various tools you can use, and share successful trend trading strategies to use in your own trading.
What is a forex trend trading strategy?
A forex trend trading strategy is a system of trading where you aim to capitalise on the directional movement of a currency pair.
A strategy is a method that describes exactly how you are going to trade in the trend direction.
The goal is to identify whether the market is moving upwards (in a bullish uptrend), downwards (in a bearish downtrend), or sideways (consolidation, within a range) and then enter trades following the direction of the trend.
For this reason, this strategy is also known as a trend following trading strategy.


Your exact strategy will depend on the type of trader you are. You may follow the trend for a long period of time if you are a position trader, or aim to take advantage of short trends if you are a day trader.
It doesn’t matter whether you trade forex or stocks or CFDs – trend trading strategies apply to all forms of trading.
Key elements of a trend trading strategy
These are the basic elements of a trend following trading strategy:
1. Identify the trend
You can use various chart tools and indicators to do your trend analysis and identify the direction of the market trend.
Common methods include:
- Drawing trendlines: You can draw trendlines on candlestick charts to clearly identify the direction of the trend. If you use TradingView, there are many tools which can assist you to do this. You draw a line connecting the lows of an uptrend, or alternatively the highs in a downtrend.
- Using moving averages: These indicators smooth out price fluctuations over a set period of time to reveal the direction of the trend.
- Using indicators: The Relative Strength Index (RSI), MACD or Parabolic SAR index can help confirm the direction and strength of a trend, or help you spot potential reversals.
2. Decide on your entry and exit points
Once you identify a trend, the next step is to find the best place to enter the trade, in the same direction as the trend.
- In an uptrend, you can look for buying (long) opportunities when the price pulls back slightly before resuming the upward move
- In a downtrend, you can look for selling (short) opportunities when the price rallies slightly before continuing downward.
3. Choose your stop-loss and take-profit points
Risk management is crucial when using a day trading trend following strategy.
You should set a stop-loss below a recent low (in an uptrend) or above a recent high (in a downtrend) to limit losses if the trend reverses.
A take-profit order can be set based on key support or resistance levels, or as the trend begins to weaken.
Chart timeframes and trend following trading strategies
Trend traders often have a medium to long-term trading horizon.
They may ride a trend for an extended period, seeking to maximise profits as the trend unfolds over days or even weeks.
Their charts may be set to show four-hourly, daily or even weekly candlestick chart patterns.
However, if you are a forex day trader, you’ll see identical trend patterns emerge using shorter timeframe trading charts, such as one-minute, five-minute or 15-minute charts.
You apply the same trend trading strategies whether you’re day trading, range trading, or breakout trading.
You’ll see identical chart patterns no matter what chart timeframe you’re using.
The only difference between day trading, and trend following over a longer period, is that each candlestick in the chart pattern represents either a shorter timeframe (day trading) or a longer period of time (trend following.)
How to do trend analysis – tools to use
Now we’ll look at the various tools you can use to identify trend direction and strength. These include:
- Drawing trendlines
- Using technical indicators
Drawing trendlines
How to use trend lines to assess trend direction
Draw a trendline by connecting the higher lows in an uptrend, or the lower highs in a downtrend.
A valid trendline should connect at least two or three price points, ie. it should touch at least two or three candlesticks, preferably on the base of the candlestick.
If the trendline touches candlesticks at the base of the main body of the candlestick, rather than on it’s tail or lower wick, then this is regarded as a stronger signal.
- An uptrend is confirmed when the price is making higher highs and higher lows, following a rising trendline
- A downtrend is confirmed when the price is making lower lows and lower highs, and follows a declining trendline


How to use trend lines to assess trend strength
The strength of the trend is indicated by the steepness of the trend line.
A steeper trend line indicates a strong trend, while a flatter trendline suggests a weaker trend.
If the trend lines become horizontal, you’ll know that asset is in a period of consolidation, with sideways ranging price action.
A significant break from the trendline can signal a trend reversal, or can indicate the current trend is losing strength.
For example, in the example above, the uptrend came to an end when price action broke down below the trend line.
Technical indicators used to assess trend direction and strength
Many forex traders use indicators like moving averages, the RSI, the MACD, and the Parabolic SAR for assessing trend direction and strength.
It’s essential to understand how each of these technical indicators works before you decide if you want to use them as part of your trend trading strategy.
Moving averages
How to use moving averages to assess trend direction
- Simple Moving Average (SMA): The SMA calculates the average price of a currency pair over a set number of periods (e.g. 50-day or 200-day.) When the price is consistently above the moving average, it indicates an uptrend. When price is below the SMA, it suggests a downtrend.
- Exponential Moving Average (EMA): The EMA gives more weight to recent price data, making it more responsive to price changes. A commonly used trading strategy is to use the crossing of a short-term EMA (e.g. the 10-day EMA) and a long-term EMA (e.g. a 50-day EMA) as a trade entry signal.
If the short-term EMA crosses above the long-term EMA, this signals an uptrend. This pattern is commonly known as a ‘Golden Crossover.’
If the short-term EMA crosses below the long-term EMA, this indicates a downtrend. This is known as a ‘Graveyard Crossover.’


How to use moving averages to assess trend strength
The greater the distance between the price and the moving average, the stronger the trend.
For example, in a strong uptrend, the price will consistently stay above a longer-term moving average, with a noticeable gap.
When price starts to consolidate around the moving average, or crosses it frequently, it could indicate that the trend is weakening or reversing.
Relative Strength Index (RSI)
How to use the RSI to assess trend direction
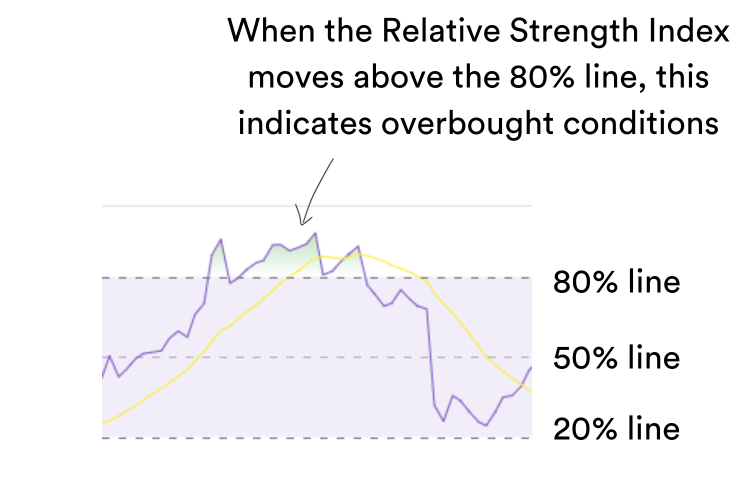
The RSI is a momentum oscillator that ranges from 0 to 100, helping you assess if a market is overbought or oversold.
- If the RSI is above 50, it indicates bullish momentum and potentially an uptrend.
- If the RSI is below 50, it signals bearish momentum and a potential downtrend.
How to use the RSI to assess trend strength
- When the RSI is in the 80-100 range, the market is considered overbought, and a reversal or weakening of an uptrend could occur.
- When the RSI is in the 0-20 range, the market is considered oversold, and a downtrend may lose strength or reverse.


Moving Average Convergence Divergence (MACD)
How to use MACD to assess trend direction
The MACD consists of a MACD line (the difference between two moving averages) and a signal line (a moving average of the MACD line).
- When the MACD line crosses above the signal line, it indicates a bullish trend.
- When the MACD line crosses below the signal line, it signals a bearish trend.
How to use the MACD indicator to assess trend strength
- The wider the gap between the MACD line and the signal line, the stronger the trend.
- A convergence between the MACD line and signal line (i.e., the lines moving closer together) can indicate a weakening trend or an upcoming reversal.


Parabolic SAR (Stop and Reverse)
The Parabolic SAR is a trend-following indicator that provides signals about both the direction and strength of a trend.
How to use Parabolic SAR to assess trend direction
The Parabolic SAR appears as dots above or below the price.
- When the dots are below the price, it signals an uptrend
- When the dots are above the price, it signals a downtrend
How to use the Parabolic SAR to assess trend strength
- The spacing between the dots can help you assess trend strength. In a strong trend, the dots will be far apart.
- When the dots start to close in on the price, it signals that the trend may be weakening or nearing a reversal.
- The SAR is also commonly used to place stop-losses by positioning them below the dots during an uptrend, or above the dots in a downtrend.


Forex trend trading strategies to use for longer timeframes
For longer timeframes, such as daily or weekly charts, you can use indicators like the Supertrend indicator or Bollinger Bands to identify long-term trends and potential reversal points.
These indicators are ideal for swing and position traders looking to capture larger price swings as part of their trading strategy.
Supertrend indicator
This indicator plots a trend-following line above or below the price, indicating the direction of the trend.
A bullish trend is signalled when the price is above the Supertrend line, while a bearish trend is indicated when price is below the line.
Here’s an example of what the Supertrend indicator looks like:


Bearish trend movement is coloured red, while bullish movement is coloured green.
This indicator makes it very clear which direction the trend is moving in.
Bollinger Bands:
Bollinger Bands consist of a simple moving average (SMA, the blue line) ) and two standard deviation bands above and below the SMA (the red and green lines.)
Narrowing Bollinger Bands indicates low volatility, while widening bands suggests increasing volatility.
Potential trend reversals are indicated when the price moves outside of the bands, like in the example below where price action moves above the top band.
This indicates the asset has possibly been overbought.


How the ‘Turtle Traders’ made trend trading strategies famous
Trend following or trend trading strategies were made popular by the famous ‘Turtle Traders’ experiment.
This experiment was conducted in the 1980s by renowned commodities trader Richard Dennis.
It is often regarded as a pivotal moment in the popularisation of trend trading strategies.
Richard Dennis believed that successful trading could be taught, and set out to prove his theory by selecting a group of individuals with no prior trading experience.
These individuals, who became known as the ‘Turtle Traders,’ were trained to use a trend following trading strategy designed to capitalise on market trends using technical analysis.
Dennis’s system focused on identifying trends and trading them using a variety of technical indicators, with an emphasis on strong risk management.
The experiment turned out to be a major success, as the Turtles applied these trend trading strategies across different markets.
Many of the original Turtles went on to have highly successful trading careers using the same trend trading strategies they’d been taught.
Final thoughts on forex trend trading strategies
The beauty of trend trading strategies is that they’re adaptable to many different sorts of trading.
It doesn’t matter whether you’re a forex trader, a day trader of stock CFDs, or a long-term commodities investor.
Your preferance may be to trade on a particular stock market, or you might enjoy the freedom of trading the forex market.
Whatever type of trader you are, or wish to become, trend following can be successfully used as the basis of your trading strategy.
If you are just starting out on your trading journey, I would suggest using a simple trading strategy, such as one based on moving average crossovers.
This is the strategy I always introduced first when teaching day trading of the stock market.
I found that beginner traders could easily use a simple moving average crossover as a successful trading strategy.
However, many forex traders use Bollinger Bands as the main technical indicator for their trend trading strategy.
Whatever strategy or indicator you choose to use to follow a trend, keep it simple!
Concentrate on your risk management principles, such as position size and where to set your stop-loss point.
I hope that you’ve found this information about tading strategies useful.
You can find out much more about trend analysis on my page specifically on this subject.
Till next time, happy trading!

If you like this article then sign-up for our newsletter or join over 42,000 traders and get The Advanced Forex Course for Smart Traders 2.0. It’s 100% free.
Sources
Marketmates uses only high-quality sources, including peer-reviewed studies, to support the facts within our articles. Read our editorial guidelines to learn more about how we fact-check and keep our content accurate, reliable, and trustworthy.
- Turtle Trader – Turtle Trader Rules https://www.turtletrader.com/rules/
- Richard Dennis – Turtle Trader – Who is Richard Dennis? https://www.turtletrader.com/trader-dennis/


