


Dealing ranges don’t form randomly; they are based on the psychology of market participants, and supply and demand.
Dealing ranges result from the actions of large-scale dealers in the interbank market who are responsible for the majority of trading in the forex market.
The motivation and psychology of these dealers is reflected in the price movements we see in forex currency pairs.
Understanding this market structure is important to retail traders, as we can learn to ride the waves left in the wake of the big players.
Let’s explore this now.
The vast sea of forex
Over 7.5 trillion of forex is transacted every day. Retail forex trading is estimated to account for only around 5% of this daily volume (we are a small part of the pie).

The vast majority of the buying and selling in the FX market is conducted by a variety of market participants, including:
- Major dealer banks, such as Deutsche Bank, UBS, Standard Chartered and Citibank
- Other banks and financial institutions
- Central banks
- Hedge funds, investment managers (such as pension funds) and trading firms
- Multinational corporations and other institutions
- Individual investors
Much of this activity is now automated, with algorithms handling the buying and selling.
Forex is the glue that binds markets together
Not all of this activity is speculation, i.e. trying to make a profit by taking a position in a currency pair.
Activity in the forex market comes from international trade and financial activities such as transactions in international stocks, bonds or real estate, hedging and capital-raising.
An ex-bank dealer friend of mine, Steve Lucas of 3C Analysis, said:

For example, if a US-based pension fund wants to invest 100 million dollars USD in Singapore shares, it needs to sell 100 million USD and buy SGD. Or, if a multinational corporation wants to buy iron ore from Australia, it needs to buy AUD.
It’s worth noting that around 70%* of forex volume comes from derivatives (such as swaps, forwards and options) and not from spot forex.
This highlights how much financial activity is related to managing risk and liquidity.
This means the major participants are taking currency positions for investment purposes or to manage the risk of price fluctuations in their portfolios.
Not surprisingly, the USD is involved in 88%* of all forex transactions, highlighting its importance to the global financial market.
What is liquidity?
Liquidity is about supply and demand
In financial markets, liquidity refers to the amount of an asset available at a certain price. This impacts how quickly and easily an asset can be bought or sold without significantly affecting its price.
- High liquidity means there are many buyers and sellers, allowing for smooth and efficient transactions
- Low liquidity indicates fewer participants, which can lead to greater price fluctuations and difficulty in executing trades
Liquidity also plays an important role in financial conditions, i.e. the more money available the easier financial conditions will be. We will learn more about this later in the model, when we cover the section on interest rates.
The role of dealers
To break down activity in the forex markets further, according to a study conducted by the Bank for International Settlements:
Around 45%* of global forex volume is inter-dealer trading. This is when major banks trade with each other. They do this to manage their currency positions and ensure they stay within their risk tolerance.
If they have a large order from a customer, they may need to offload part of the order to another bank.

The majority of this inter-bank activity (78%) is conducted by major dealer banks in the financial centres of the UK, US, Singapore, Hong Kong and Japan.
At any given moment, traders at these banks have millions of dollars in orders they have received from market participants.
These orders could be due to global trade, hedging activity or managing liquidity. They could also be trades taken with another bank.
The role of the dealer is to execute these orders on behalf of their customers (i.e. provide liquidity and a smoothly functioning market) and to generate a profit from these orders for their bank employer.
Banks make their money in two main ways:
- Banks charge the bid-ask spread when they receive orders from their customers. The higher the spread, the more profit the bank will make. The larger the order they receive, the wider the spread might be.
They lock in their profit when they match a long and a short trade together. The second leg of the trade will either come from another customer or another dealer.

- Banks traders may hold speculative positions. A bank trader may take a position if they think the currency pair is likely to move in their favour. Bank traders can see the order flow (orders they have received from other market participants), which helps them determine where a currency pair might head next. For example, a large number of upcoming buy orders may push a currency pair higher, thus a dealer can take their own long position, knowing that there will be demand for the currency pair.
Now that we know what the bank traders are doing (executing orders for market participants) to make a profit (by earning the bid/ask spread or taking a position, at the same time as managing their risk), we can now understand what is going on behind the scenes of chart price action.
The game played by dealers
Much of the game of forex is played by banks trading with each other, with the spread they receive from orders as the stakes (which is a huge stake, considering around 7.5 trillion of forex is transacted each day.)
When I say stakes, what I mean is bank traders can lock in their profit by just capturing the spread, but they may be prepared to risk this profit to make more by holding a position if they think the market is likely to move in their favour.
As legendary currency trader Bill Lipschutz said:
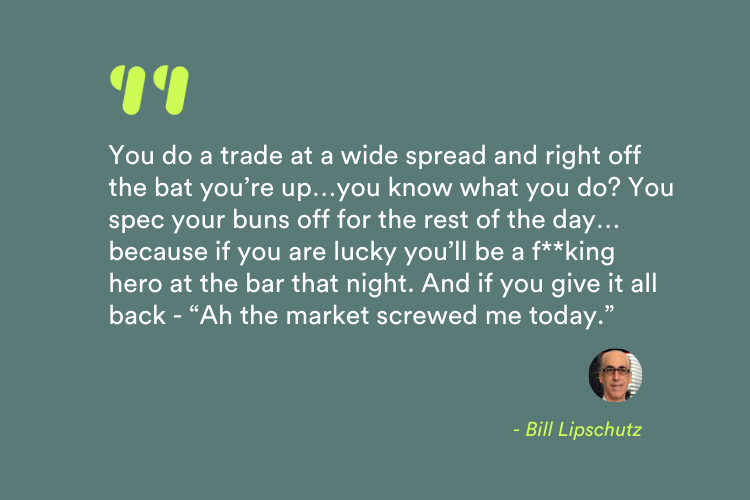
While this quote is a little old now, it serves to make the point that bank traders may risk the profits they have made from the spread to make more. If they have made $10,000 from the spread on that day, they may risk that to make $20,000 or more.
All this financial activity heavily influences market structure.
Forex market structure is based on psychology
Let’s imagine a large order comes in for a bank trader to execute, and the market starts to move rapidly in the wrong direction. This could result in lost income for the trader (if the price moves beyond the spread they have already received on the trade).
Therefore, it’s better for the trader holding a larger order if the price is range-bound, where there is plenty of liquidity.
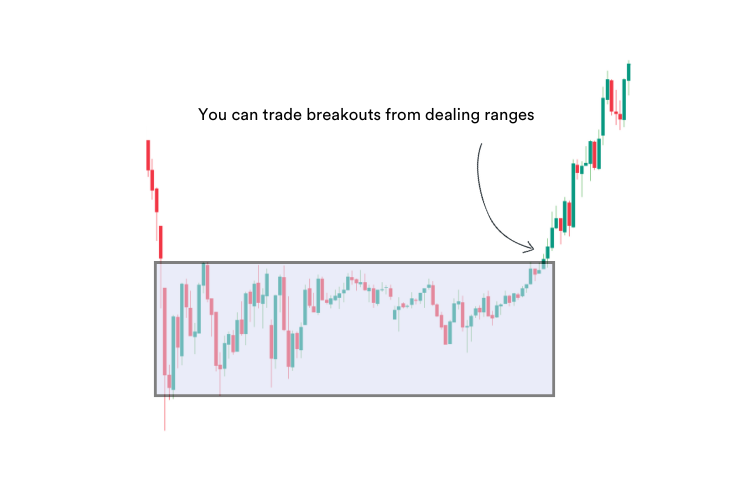
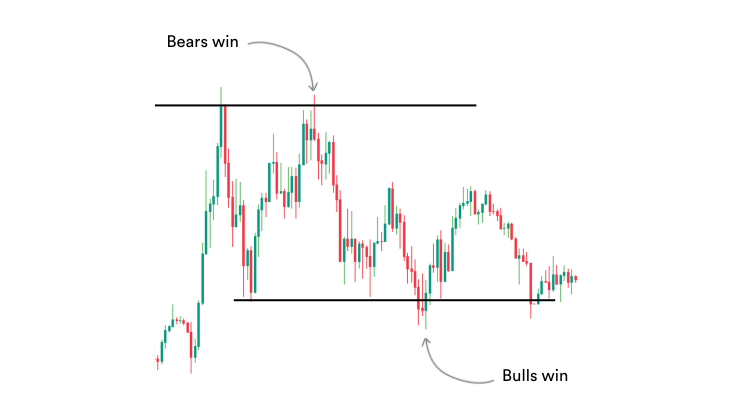
Because of the need to keep prices relatively stable, the trader may use buy and sell orders to defend the range, by selling near the top and buying near the bottom.
This will push the price back towards the middle of the range. Sometimes you see a ‘battle’ between buyers and sellers at these levels, with one trying to break the range and the other trying to hold it.

If a dealer does end up on the wrong side of a fast-moving market, they will get out quickly to avoid taking a large loss, further increasing the momentum of the trend.
Once a trend breaks out, traders may look to establish positions in the direction of the trend.
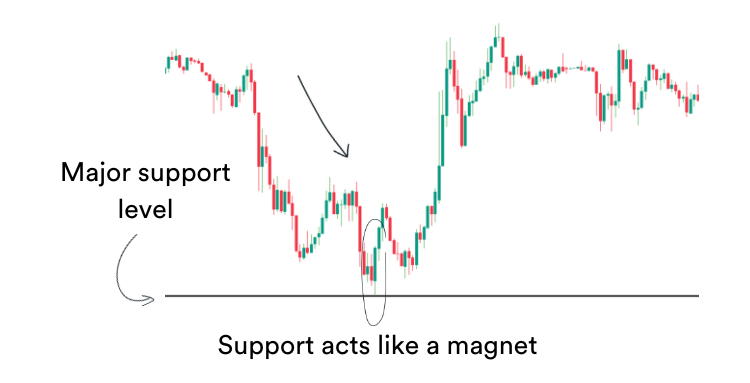
Often the trend will pause at a support or resistance level (where new orders are resting) before a new range forms.
Remember, price moves based on supply and demand. If there are more buyers than sellers the price will go up, and vice versa.
If the price hits a support or resistance zone, it’s like a fall cushioned by a pillow of orders.
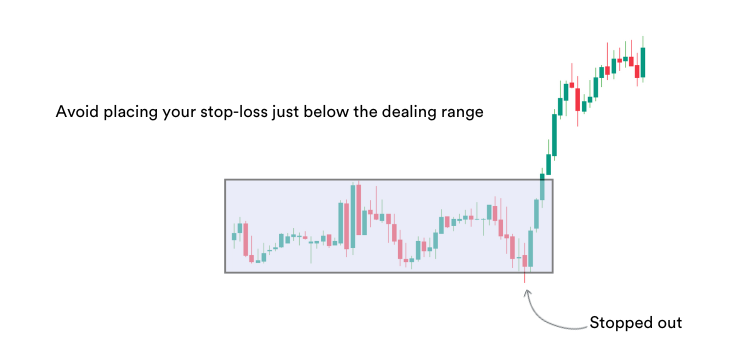
Sometimes there will be a false breakout, which knocks out the weak players and allows the traders with the larger market-moving positions to enter trades at a better price.





Remember, the more you know about how the market works, the better equipped you will be when you develop your own trading strategy.
Over the course of this seven-part series, I’ll help you distil all this information down into a simple set of trading rules that will allow you to take a small chunk of profit out of this very large market.
In Part Three, we take a look at sentiment – the short-term driver of the currency markets.
If you missed Part One you can find it here.
Cheers,


