


Price forms the main building block of our model of the forex market. It provides insight into market psychology and where the market may be headed.
At all times, you should understand what the price is telling you.

We use five universal factors that work across all timeframes and currency pairs to get an accurate picture of what the price is telling us.
These factors are:
- Market pattern (type)
- Overbought/oversold
- Candlestick chart patterns
- Simple tops and bottoms
- Support and resistance
The first part of understanding the price is determining the direction and volatility of a currency pair.
You can see changes in direction and volatility on this chart of USD/JPY:


Direction and volatility can be categorised into different market types.

How price behaves in different market types
A market type has two parts, one for the direction (bullish, bearish or sideways):
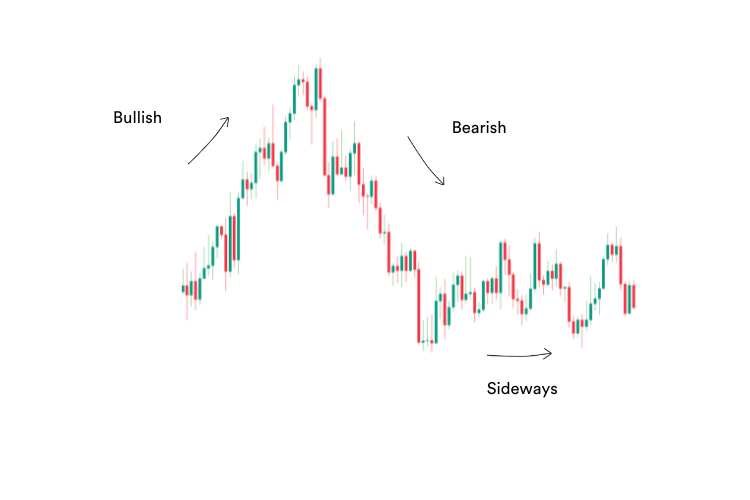

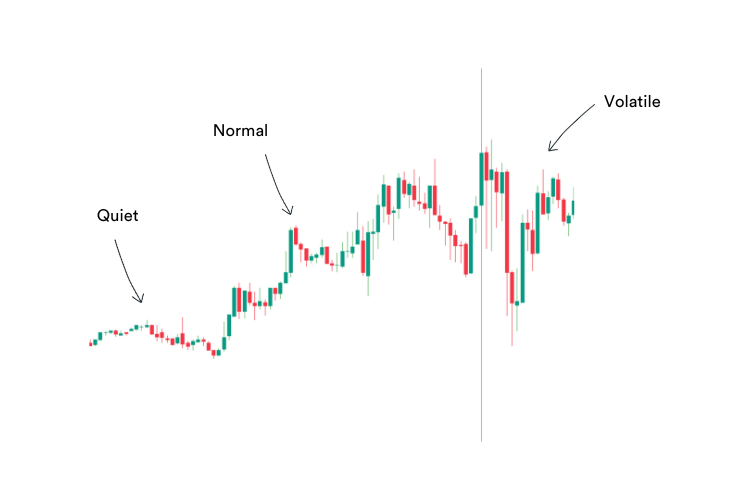

When you add these two parts together you arrive at the market type. There are also extreme market types, which I’ll cover later.
The idea is to identify the current market type, and then apply the correct entry or exit strategy for that particular market type.
For example, you should be buying in bull market types, and selling in bear market types.
In this model, we use eight primary market types.

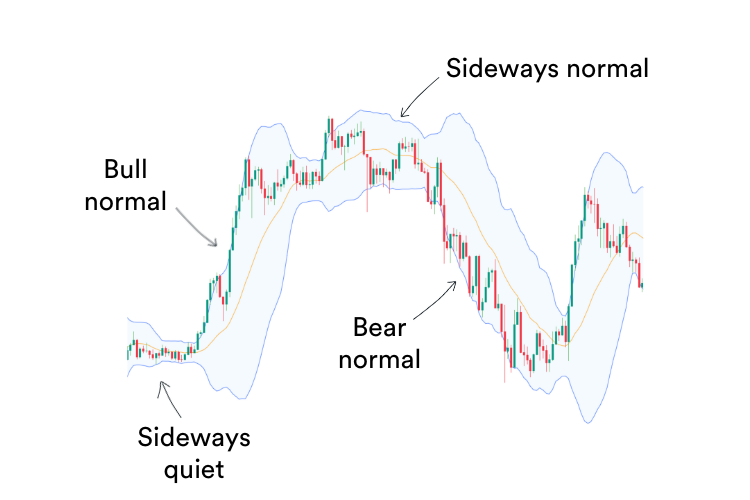
- Bull normal – an upward trending market making new highs
- Bull volatile – a rapidly rising bull market, which is often a sign that a trend is about to end when conditions become overbought
- Bear normal – a downward trending market, making new lows
- Bear volatile – a rapidly falling bear market, often occurring near the end of a trend when conditions get oversold
- Sideways quiet – when the market forms a tight range, often before a strong breakout
- Sideways normal – a laterally moving market, trading in a range
- Sideways volatile – A wildly swinging market, often occurring after a bull or bear volatile market for a short period of time before settling into a sideways normal market.
- Extreme – Where there are large movements in a short space of time
Here are some market types on a chart:

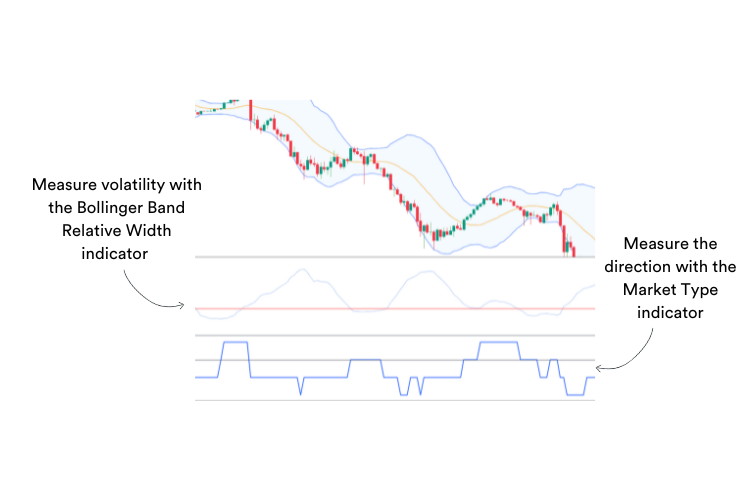

For more detailed information on market types see Lesson #3 of ‘The Advanced Forex Course for Smart Traders 2.0.’
Trend and volatility are not the only considerations. There are a few more factors that traders should keep an eye on.

Overbought and oversold conditions signal pending reversals
Traders need to understand when conditions are overbought or oversold. These conditions occur near the end of a trend when the market runs out of buyers or sellers.
Here is an example of what overbought looks like on a chart:

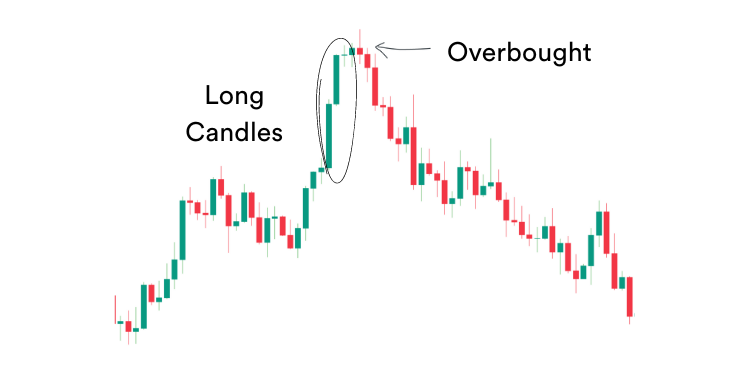
This often results in a reversal, which can be quite sharp. These are good times to take some profit or to look for contrarian opportunities (picking tops or bottoms.)

To identify these conditions, you can use the RSI or other oscillators. I use both Bollinger Bands and the RSI for this, as I find they give me good clear indications when either overbought or oversold conditions apply.

Candlestick patterns provide insight into price pressure
Candlestick patterns provide insight into market psychology and short-term buying or selling pressure.

For example, several long red or green candlesticks one after the other indicate a strong push in that direction.
Dojis indicate market indecision, as neither buyers nor sellers are choosing to make a strong move, so the price remains virtually the same at open and close.
Candlesticks with short bodies, but long heads or tails, indicate there was a push to move the price, but that push ran out of steam, so the price ended up close to where it started.
The direction of the long head or tail gives a clue about the direction of the failed push.
A candlestick pattern can indicate a momentum shift or even a long-term change in direction.
In this model, the following candlestick patterns provide some of the best insights:
Morning Stars and Evening Stars

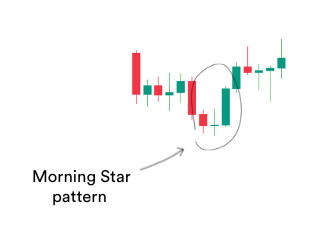
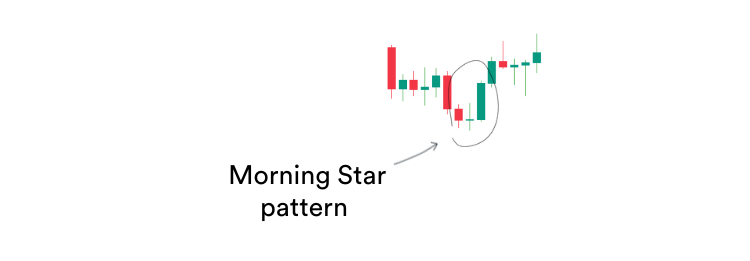


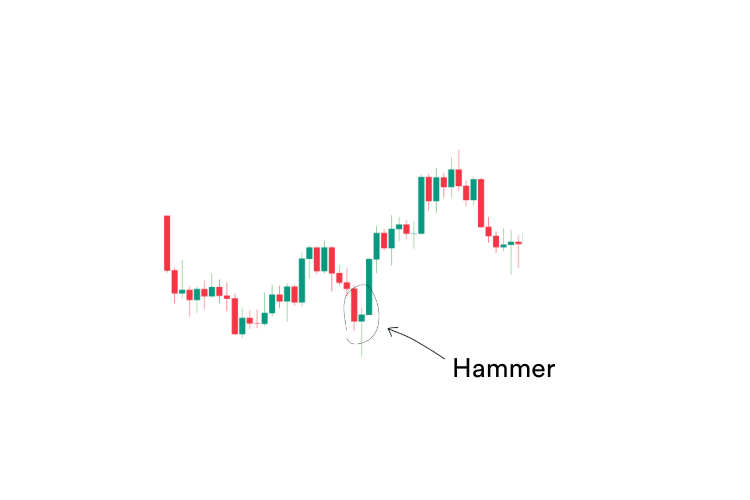
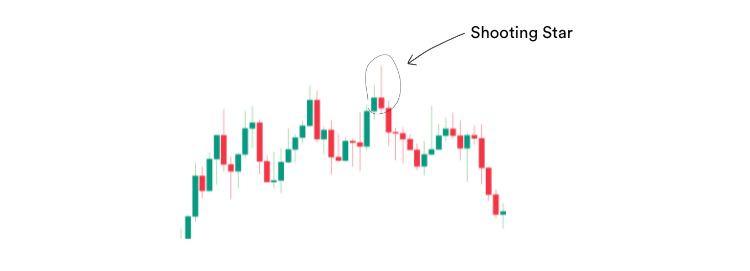
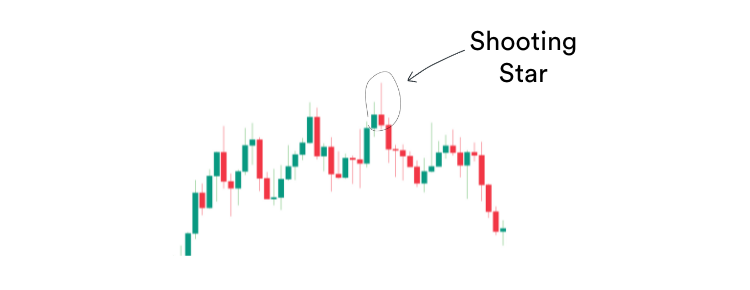
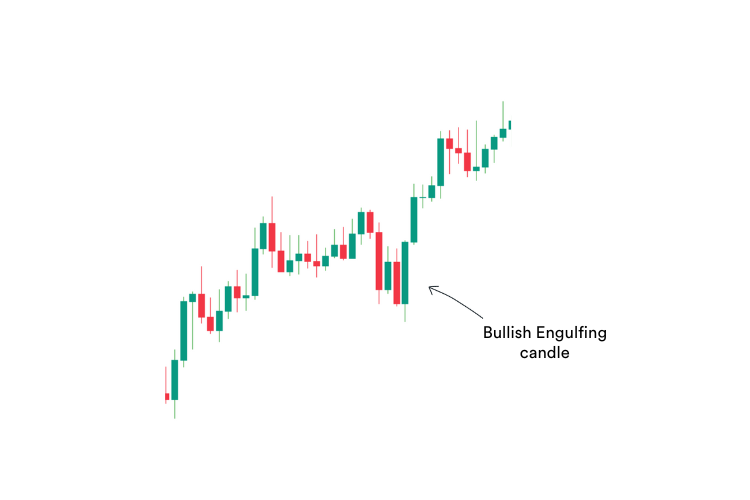
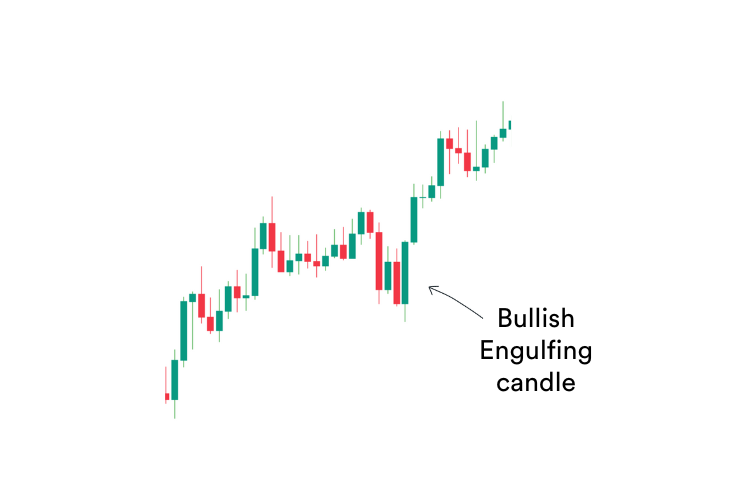
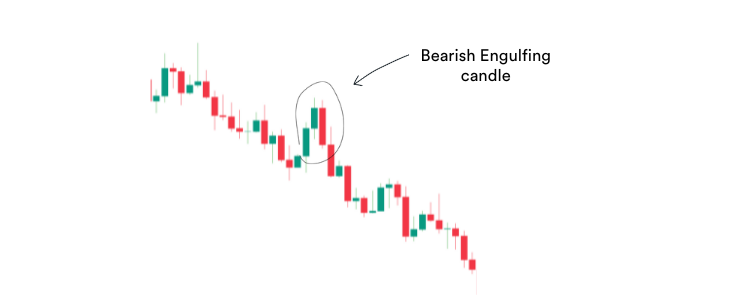
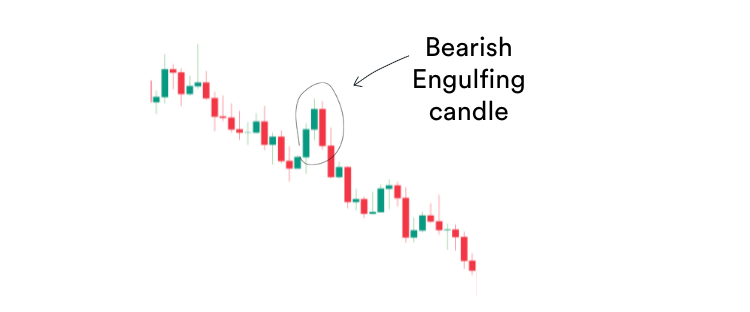
If these patterns form near the bottom of a downtrend or the top of an uptrend, they are signals that the trend may be running out of steam.
If they form off support and resistance levels in a sideways market type, it indicates the sideways range may hold for now.
If they form after a pull-back in a trend (in the direction of a trend) they signal the trend may be about to resume.
For more detailed information about candlestick patterns, you can get a breakdown here.

Simple double top and bottoms trigger changes in direction
For the purists, I am not talking about classical double tops and bottoms. Rather, be on the lookout for rejections of new highs or lows.
- If the price makes a new high and then attempts to breach it, but fails, this is a sign that the bullish trend could be over.
- If the price makes a new low and similarity fails to breach it, this is a sign the bear trend could be over.
Here is an example:


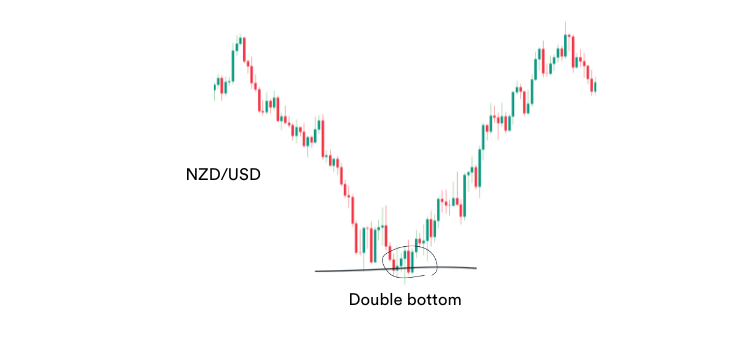

In particular take note if they occur during overbought or oversold conditions or near major support and resistance levels.

Support and resistance levels provide insight into supply and demand
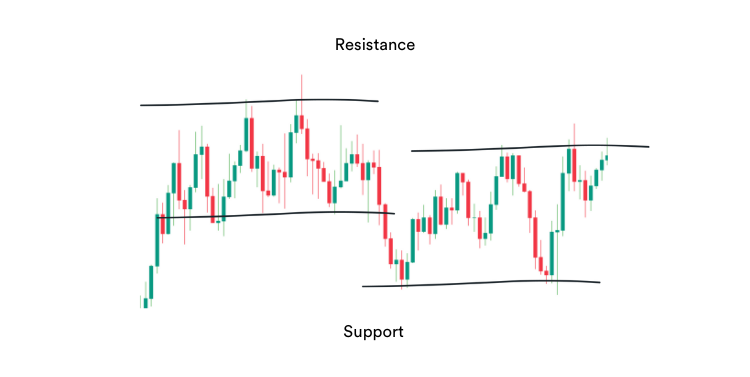
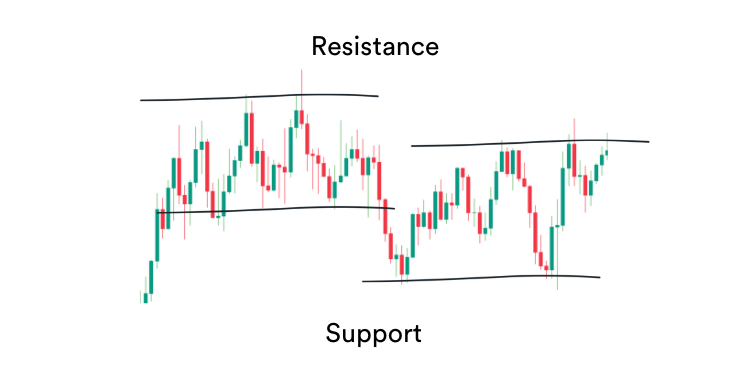
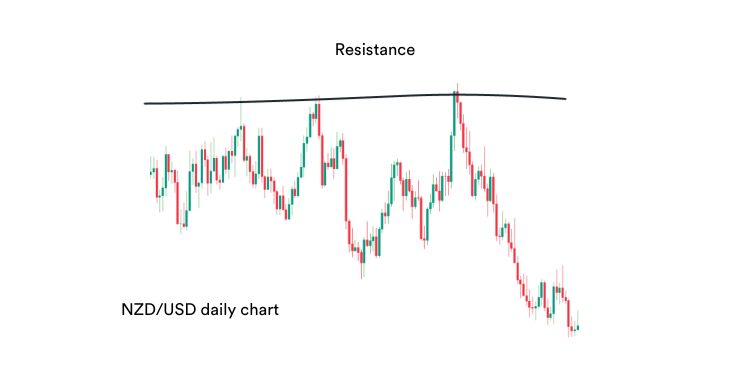
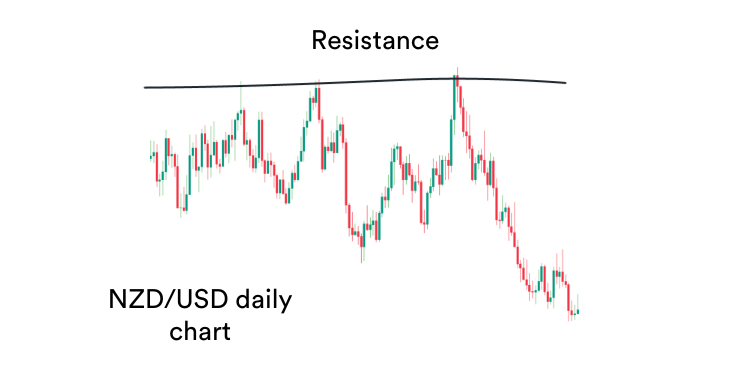
The final tool in our toolbox is support and resistance. Support and resistance act as reference points for forex traders.
Support and resistance are key price levels that have historically been turning points. The theory is that if these key levels stopped the market once, they are likely to do it again.
Here is an example on a chart:
Because of this, currency pairs often change direction at support and resistance levels.
Importantly, if a level is breached, stop-loss orders resting above or below the levels can cause the new trend to accelerate.
Imagine if a support or resistance level is breached, then all those traders planning on it not being breached now need to exit their positions.
Additionally, other traders may have put their stop-losses behind those levels in anticipation that the level would hold.
So, if a resistance level is breached, all the short traders will now need to get out of their trades or have their buy stop-loss orders triggered.
All this buying adds to the buying made by traders entering the new trend. This buying activity provides momentum to the trend, accelerating it.
Of course, the same works in reverse for support levels.
Adding your own spice to the mix
You may have other technical analysis tools and techniques that you like. It’s fine to add these to your market model with a couple of caveats.
- The price in this model is not a trading strategy. You build the model first before creating a plan to trade it
- When you look at a chart, it should provide you with clarity. If it doesn’t you are possibly overcomplicating things
Remember, all technical analysis tools are simply different ways to look at price action. Unlike the stock market, there is no volume.
So, as long as you have a way to assess each of the above factors, that is all you need. Having multiple tools for the same job makes for a confused trader.
Cheers,


