In this lesson, we look at different market patterns, and how to develop strategies to trade different market types successfully.What are market pattern types?
When I talk about market types, what I’m referring to is a way to define current market conditions using price action. Two things determine the market type:- Direction
- Volatility
Market direction
We break down the direction into three types:- Bull (upward trending)
- Bear (downward trending)
- Sideways (no trend)
Market volatility
Similarly, volatility comes in three types:- Quiet (little movement)
- Normal (a bit of movement)
- Volatile (a lot of movement)
How many market types are there?
Market Wizard Dr Van Tharp suggested there may be as many as 40 market types. However, in my forex trading, I use eight primary market types:- Bull normal
- Bull volatile
- Bear normal
- Bear volatile
- Sideways quiet
- Sideways normal
- Sideways volatile
- Extreme
There are several methods of identifying market types. Dr Van Tharp used an algorithm that spits out the market type in a spreadsheet.
I prefer to use the Bollinger Bands indicator to identify the market type, as it’s simple and visual.
(Van Tharp liked this method too, and I wrote an article about it in his newsletter)
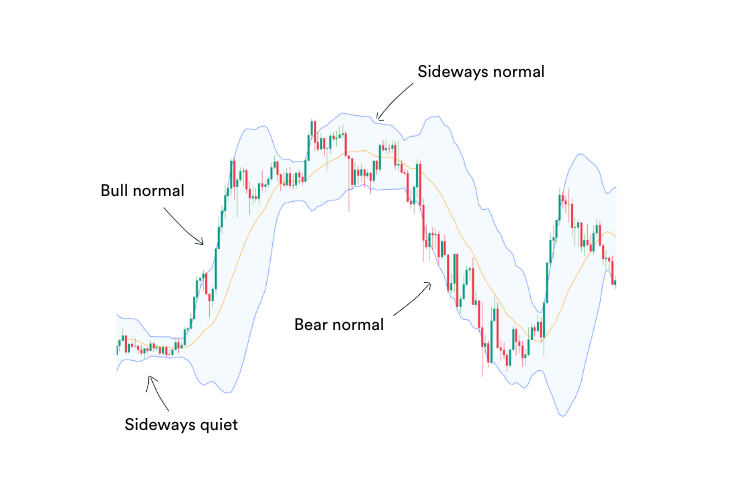
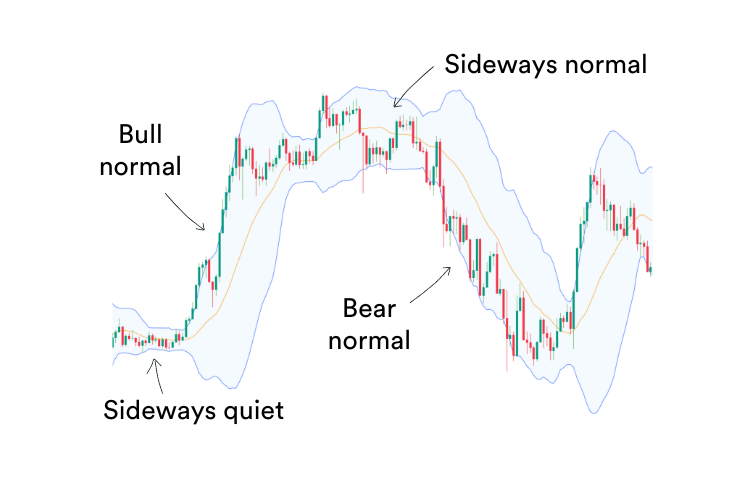
Using Bollinger Bands you can see the primary market types here on the weekly chart of the USD/JPY:
Before we get into the details of this method, it’s important to understand why market types exist in the first place.

The psychology behind market types
Market psychology causes price action to repeat the same behaviour over and over again.
For example, after a trend, there will often be a period of consolidation in the market (sideways quiet) with prices staying within a narrow range while traders wait for clarity or news.
After this period of consolidation, a trend (bull or bear normal) will break out, triggering stops which give the trend some initial momentum.
Fearing missing out, traders will then accumulate positions in the direction of the trend.
Prices will then move up steadily and the trend will start to accelerate (bull or bear volatile) as the traders don’t want to take positions against the trend.
Eventually, profit-taking will occur (perhaps around a key support or resistance level, or breaking news) and the price action will become volatile and choppy (sideways volatile.)
After a while, the price will settle down into the new equilibrium, with volatility decreasing and no clear direction (sideways normal.)
Price action will eventually slip back into a period of consolidation (sideways quiet) before the cycle happens over again.
While markets don’t always repeat this behaviour, it provides us with a solid framework.

An easy technique for identifying the market type
As I mentioned, to identify market type I use Bollinger Bands.
You can use this technique on weekly charts, daily charts, hourly charts, or whatever timeframe suits you.
I use the 15-minute chart for day trading, and the daily chart for longer-term positions.
The shorter your trading horizon, the lower the timeframe you will use to identify market types.
I use the standard 20-period, 2-deviation Bollinger Bands.
Quiet, normal, or volatile?
The width of the Bollinger Bands dictates if the market type is quiet, normal or volatile.
- When they are contracted, it is a sign of a quiet market type.
- When the Bollinger Bands are expanded slightly, it is a sign of a normal market type.
- When they are stretched, it is a sign of a volatile market type.


Since the first version of this course, a trader friend and myself developed an indicator called the Bollinger Bands Relative Width indicator.
This can be used to precisely measure volatility.
Here is an example of how it works:


The indicator is the blue line below the price candlesticks. If the indicator is:
- Below the red line, it is a quiet market type
- Above the red line, it is a normal market type
- Double the distance above red line, it is a volatile market type
If you use TradingView as your charting program, you can access the indicator here.
Bull, bear, or sideways market?
If the price is trending in the direction of the upper or lower Bollinger Bands, then that will indicate a bull (upper) or bear (lower) market.
If the price is between the two bands without a clear direction, the market type is sideways.


The Market Type indicator
We have also developed an indicator called the Market Type indicator that will tell you if the market type is bull, bear, or sideways, without using Bollinger Bands. You can get this one here too.
Here is an example showing the Market Type indicator changing from a bullish indicator at the beginning, to sideways price action, and then when it crosses the central line, to a bearish indicator as price action falls.


- When the indicator is flat it represents a sideways market type.
- If the indicator is above the middle line, it represents a bull market type.
- If the indicator is below the middle line, it represents a bear market type.
The indicator will also tell you if the market type has transitioned into a bull or bear volatile.
Here is an example of the indicator showing the transition of the market from a period of consolidation to a bear market.
See how the indicator dips below the middle line into bear territory?


Extreme market types
Although extreme market types rarely occur, it’s important to plan for them as they present great risks and opportunities.
These market types typically happen around highly volatile or surprise news events, causing dramatic market moves compared to normal.
Some examples of when extreme market types occurred include:
- Brexit – when the UK left the European Union
- Trump – when Donald Trump was elected as US president
- Swiss National Bank crisis – when the Swiss Nation Bank removed its currency peg
There are other times when the lines may be blurred between highly volatile and extreme market types, so you will need to use a degree of judgement.
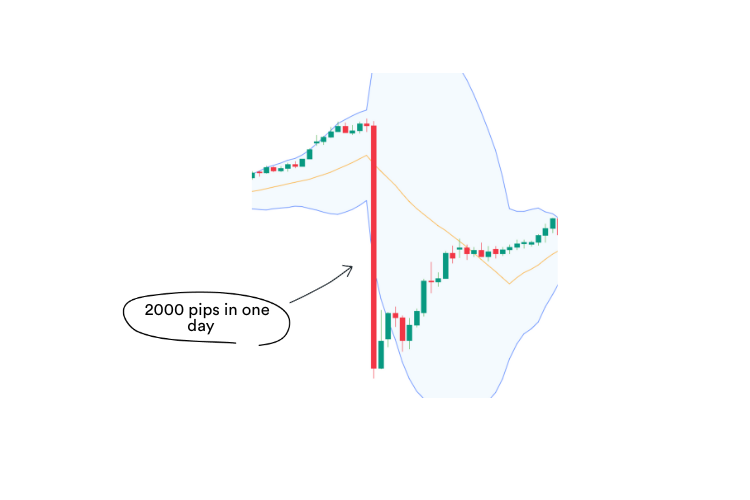
Here is what an extreme market type looks like.
This is the move on GBP/USD after the Brexit vote which crashed from a high of 1.5000 to near 1.3200 in one day.


Market types in action
Let’s take a look at a chart example of each of the eight market types.
Bull normal
In a bull normal market type, the price is trending upwards between the mid and upper Bollinger Bands.


Bull volatile
In a bull volatile market type, two or more candles are trading above the upper Bollinger Bands in an upwardly trending market. The market becomes overbought.


Bear normal
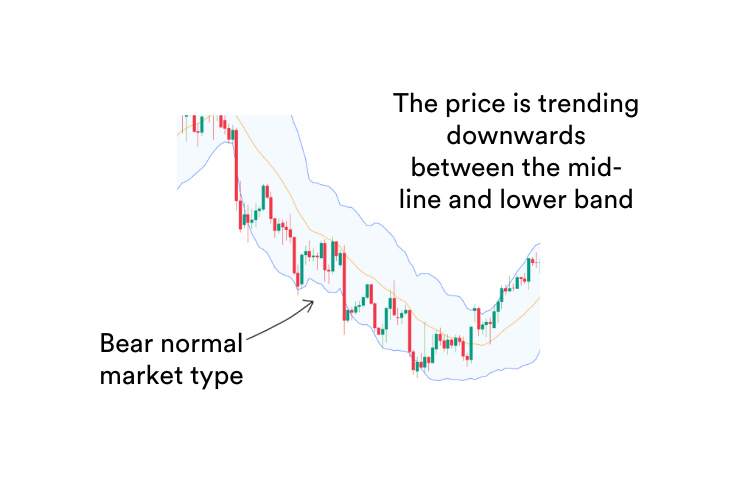
In a bear normal market type, the price is trending downwards between the mid and lower Bollinger Bands.


Bear volatile
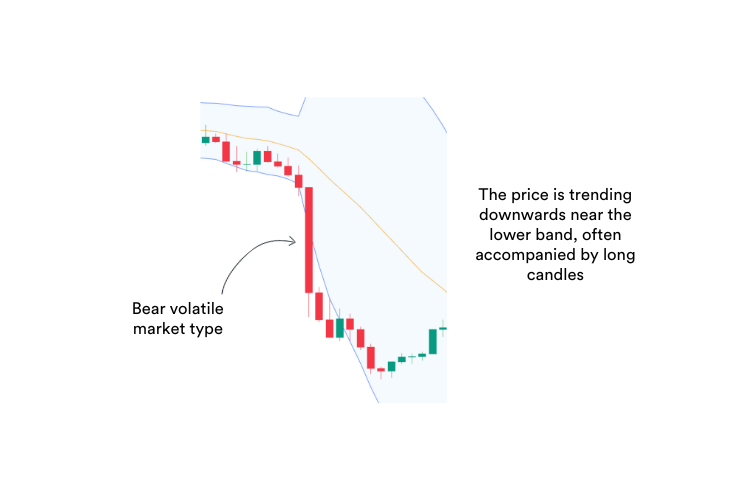
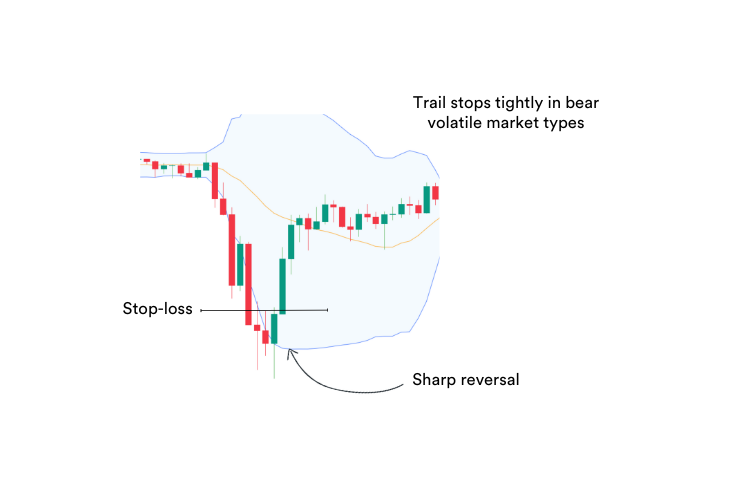
In a bear volatile market type, two or more candles are trading below the lower Bollinger Bands in a downwardly trending market. The market becomes oversold.


Sideways quiet
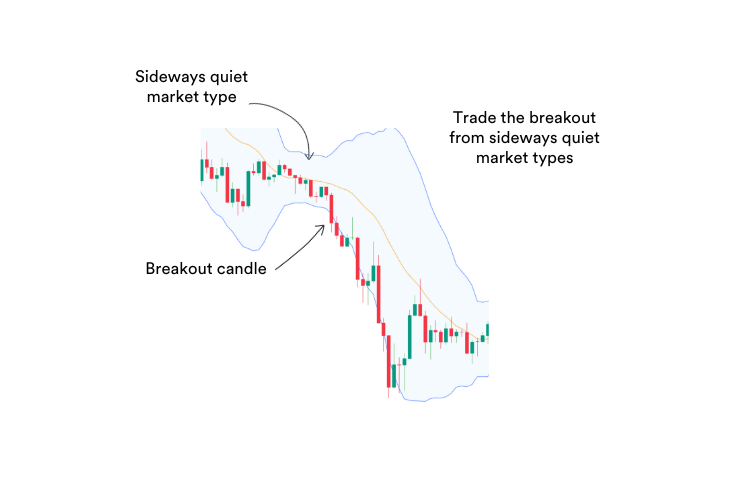
In a sideways quiet market type, the Bollinger Bands are narrow and there is no clear trend.


Sideways normal
In a sideways normal market type, the Bollinger Bands have slightly expanded and there is no clear trend.


Sideways volatile
In a sideways volatile market type, the Bollinger Bands are stretched and the price movements are rapid between the top and bottom of the range. There is no clear trend.


Extreme
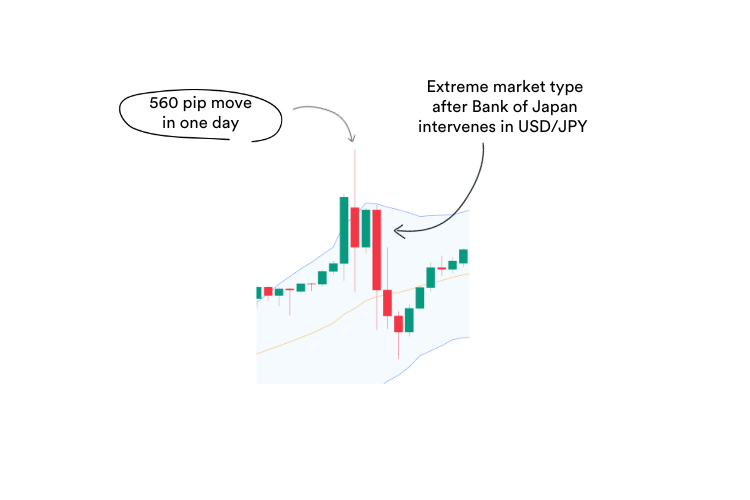
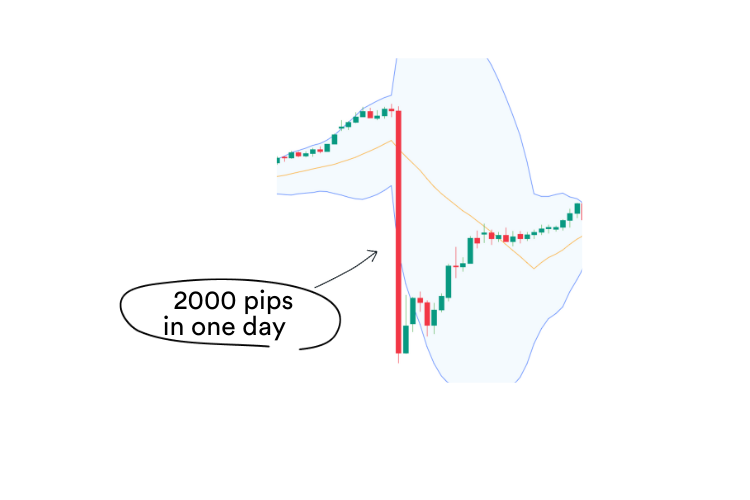
In an extreme market type, the price moves rapidly in one direction, moving several times the daily range in a short space of time.
For example, this is the price action when the Bank of Japan intervened in the USD/JPY.


Identifying upcoming market types
Like the sea turns from calm to stormy, so do the markets.
One of the tricks of understanding market types is knowing what to expect next.
Trading is very much about probabilities.
If you know which market type(s) will most likely follow next, then it can give you a big edge and increase your probability of making a successful trade.
The usual order of market types
Here are the primary market types and an indication of what often comes next:
- Sideways quiet.
- Bull or bear normal.
- Bull or bear volatile.
- Sideways volatile.
- Sideways normal
- Sideways quiet (again)
As you can see, the markets move in a rhythm, from consolidation to trend to volatility and back again.
If you learn this rhythm, you will know what to expect so you can plan for it in advance.

Different strategies for different market types
Now that you know how to identify the market type, let’s briefly discuss how you should trade in each different one.
Later in this course, we will go into more depth about when to buy and sell, but it’s helpful to see how the market type relates to your trading strategy now.
Bull Normal
The usual approach for bull market types is to buy either on a pullback or breakout to a new high.


Bull Volatile
You should hold on to your trades, and avoid entering new positions.
You can expect a sharp reversal in bull volatile market types, so keep a tight trailing stop and exit once the market starts to reverse.
This way you can avoid giving back your profits.


Bear Normal
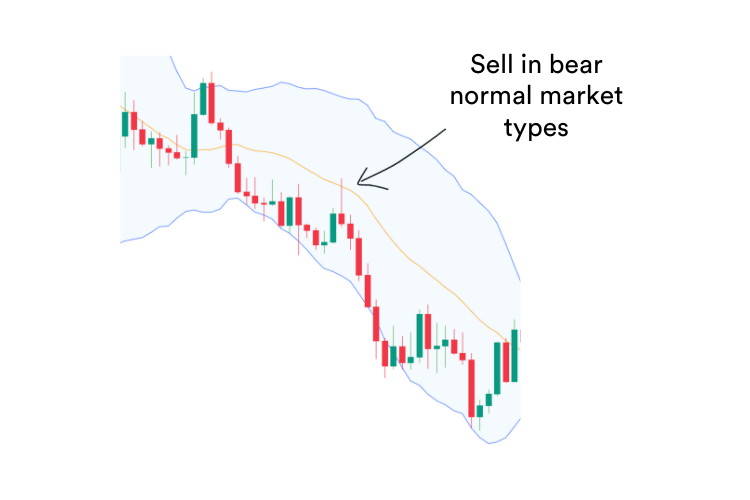
The usual approach for a bear normal market type is to trade short by selling on a pull-back or on a breakout to a new low.


Bear Volatile
Like in a bull volatile market type, you should avoid entering new positions and hold on to existing positions.
These market types can reverse quickly so you should be prepared to take profits.


Sideways Quiet
In a sideways quiet market type, it’s best to wait for the breakout to occur.
This is my favourite market type to trade, as it allows me to capture a trend early on.
Often the breakouts fail, so you need a disciplined risk management approach.


Sideways Normal
In a sideways normal market type, for a short position you can look to sell at the top of the range, and for a long position, buy at the bottom of the range, with the expectation that prices will stay within the range.


Sideways Volatile
Similar to a sideways normal market type, you can go short and sell at the top of the range, and buy at the bottom of the range.


Extreme
Ideally, you can avoid extreme market types, but sometimes this is not possible.
- Once the initial extreme move occurs, there may be stand-out trading opportunities as the market is typically out of equilibrium. If you’re in an extreme market type that’s going your way, either exit or hold on (if you’re brave).
- If you’re in an extreme market type that has gone against you, then you could exit, or if you are well capitalised, you could consider holding on, as there will likely be a recovery.
- If you are not in a position, stand on the sidelines and wait for an opportunity. Ideally, find a trade that has a superior risk/reward profile as the market reverts to the mean.
As an example of extreme market movement, this is when the Swiss National Bank removed the peg against the Euro.


Use market types to build a winning forex trading system
Building a winning forex trading system does not have to be difficult.
However, it will be if you don’t use market types.
Instead of focusing your time on trying to find a unicorn – a trading strategy that works in every market type – identify the market type first.
Then, apply a simple, low-risk/high-reward trading strategy that fits.
In the next lesson, we look at setting goals for your trading.
Lesson #4 Setting Winning Forex Trading Objectives
Bye for now,

Sources
Marketmates uses only high-quality sources, including peer-reviewed studies, to support the facts within our articles. Read our editorial guidelines to learn more about how we fact-check and keep our content accurate, reliable, and trustworthy.
- John Bollinger – Bollinger Bands. https://www.bollingerbands.com/
- Sam Eder – The Consistent Trader https://www.amazon.com.au/Consistent-Trader-Winning-Trading-Psychology/
- Dr. Van K. Tharp – Tharp’s Thoughts Weekly Newsletter https://vantharp.com/tharps-thoughts-weekly-newsletter-archive/