


Understanding the behaviour of the forex market is crucial to making informed trading decisions.
The two main approaches that all traders use to analyse the forex market are technical analysis and fundamental analysis.
Each of these methods offer insights into currency price movement, and help traders predict future market trends and price action.
In this article we’ll explain the differences between these two approaches, and detail how they are used in forex trading.
We’ll then explain how both these methods of analysis need to be used in conjunction with each other to make the best trading decisions.
What is fundamental vs technical analysis?
Fundamental analysis involves evaluating the economic, financial, and geopolitical factors that influence currency prices.
This approach to price analysis is rooted in the belief that the intrinsic value of a currency is determined by these fundamental factors.
Fundamental analysis has been a cornerstone of investing and trading since the early 20th century.
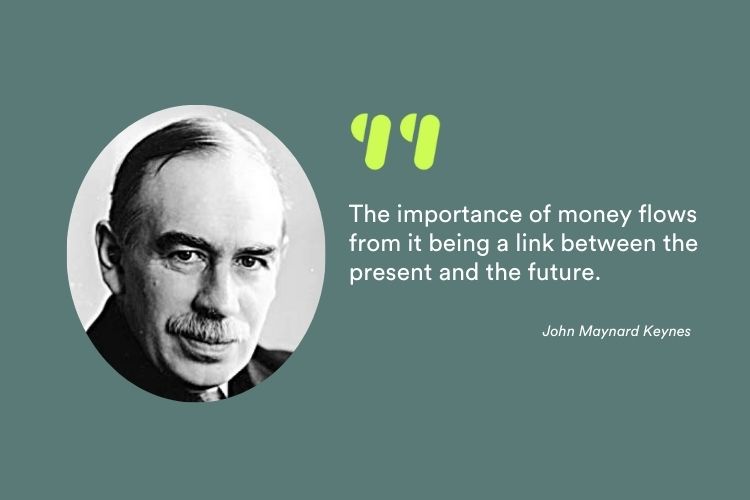
It is based on the work of legendary economist John Maynard Keynes, who emphasised the importance of macroeconomic factors in market analysis.
On the other hand, technical analysis focuses on the study of past market price data to forecast future price movements.
This method is based on reading price charts, candlesticks, indicators and indexes.
It comes from a belief that all relevant price information is reflected in the trading charts, and therefore, by studying historical price data and trends, traders can predict future trends.
This approach also has a long history dating back to the 17th century in Japan, with the development of candlestick charting by the father of candlestick charts, Munehisa Homma.
Homma was a Japanese rice trader who discovered that the rice market was influenced by the emotions of traders, while still acknowledging the effect of supply and demand.
While fundamental analysis provides a broad, macroeconomic perspective, technical analysis offers a more focused, data-driven approach to short-term trend trading.
Most traders use both strategies together to create a well-balanced approach to profitable forex trading.
What does fundamental analysis consist of?
Traders who use fundamental analysis examine indicators such as:
- Gross Domestic Product (GDP) growth
- inflation rates
- interest rates
- employment figures
- central bank policies and announcements
The goal is to understand the economic health of a country, and predict how it will impact a currency’s value.
Fundamental analysis provides a long-term overview of currency value, making it ideal for analysts who focus on macroeconomic trends.
Macroeconomics is the study and analysis of large-scale or more general economic factors.
Therefore, fundamental analysis offers insights into the broader economic landscape, helping traders anticipate longer-term trends and market shifts.
This approach helps analysts understand the intrinsic value of a currency, which can be useful for identifying undervalued or overvalued currencies.
Why is fundamental analysis important to retail forex traders?
For the retail trader, the importance of fundamental analysis is that the release of macroeconomic data often causes sudden and large price movements.
For example, the release of GDP figures or a government statement about interest rates can have an instant and dramatic affect on the price of a currency pair.
This is the main reason why forex traders need to be acutely aware of upcoming economic announcements and the release of financial data.
Even if you don’t really understand what a financial report is saying, knowing when it is to be released is important.
This way, you can use technical analysis clues to either decide to trade a significant news event, or stay out of the market when one is due.
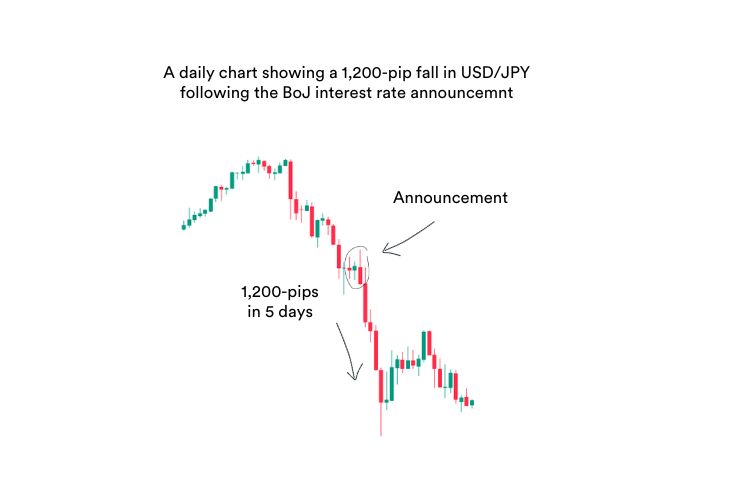
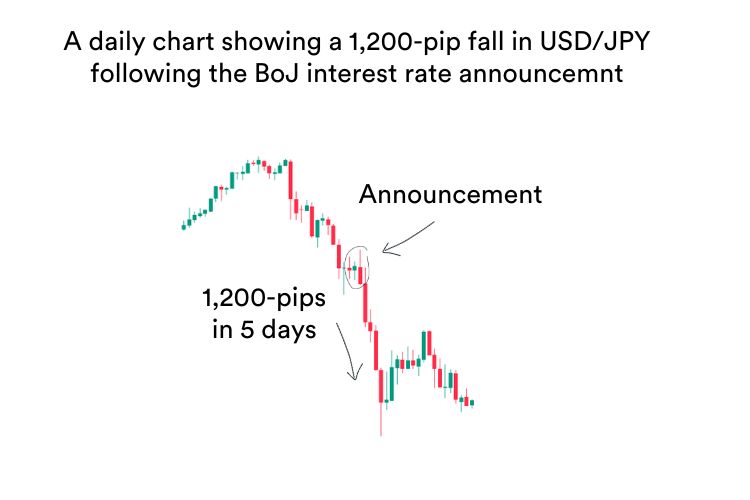
The example below shows the dramatic fall of the US dollar after the Bank of Japan announced a change in interest rates.
Which reports and announcements do fundamental analysts consider?
Fundamental analysts look at a variety of factors to help them determine the direction a currency may be heading. These factors include:
Economic indicators
Fundamental analysis focuses on the economic factors that influence a currency’s value.
Traders look at key economic indicators like GDP growth, inflation rates, interest rates, and employment data to assess the overall health of an economy.
Central bank policies
Central banks play a crucial role in fundamental analysis.
Traders monitor central bank policies, such as interest rate decisions and quantitative easing measures, as these directly impact currency values.
Political events
Political stability or instability can greatly affect currency prices.
Election results, government policy announcements, and geopolitical tensions are all of interest to fundamental analysts.
Market sentiment
Fundamental analysts also consider broader market sentiment, which can be influenced by global events like natural disasters, armed conflicts, or the signing of significant economic or regional agreements.
Vital reports that forex traders need to look out for
The reports you should be on the lookout for naturally depends on which currency pair or pairs you are trading.
These are the most important reports and figures for each of the main currencies:
1. US Dollar (USD)
Fundamental analysts closely monitor several key economic reports and announcements related to the US dollar, which is the most traded currency in the forex market:
- Non-Farm Payroll (NFP) report: Released on the first Friday of every month at 8:30am Eastern Time (ET), this report shows the change in the number of employed people during the previous month, excluding the farming industry. It is a key indicator of economic health.
- Federal Reserve interest rate decisions: The Federal Reserve’s decisions on interest rates are pivotal for USD traders. Changes in the federal funds rate can have a significant impact on currency value. The Federal Open Market Committee (FOMC) meets eight times a year, with announcements typically at 2:00pm ET.
- Gross Domestic Product (GDP): This report provides an overview of the economic performance of the country. A higher GDP suggests a stronger economy, potentially boosting the USD. This report is released quarterly, usually at the end of the first month following the quarter, at 8:30am ET.
- Consumer Price Index (CPI): A measure of inflation, the CPI indicates the changes in the price of goods and services. Inflation impacts the purchasing power of the dollar. This figure is released monthly, typically around the middle of the month, at 8:30am ET.
- Retail Sales: This report indicates consumer spending, which is a significant driver of economic growth. Released monthly, around the 13th of each month, at 8:30am ET.
- FOMC Meetings: The minutes from the Federal Open Market Committee meetings offer insights into the economic outlook and potential monetary policy changes. Released three weeks after the FOMC meeting, at 2:00pm ET.
2. Euro (EUR)
For the euro, fundamental analysts focus on reports and announcements from the European Union:
- European Central Bank (ECB) interest rate decisions: Similar to the Fed, the ECB’s decisions on interest rates are crucial for the euro’s value influencing economic conditions across the Eurozone. The ECB meets every six weeks, with statements typically released at 12:45pm Central European Time (CET), followed by a press conference at 1:30pm CET.
- GDP Reports for the Eurozone: As the Eurozone consists of multiple countries, the collective GDP of these nations is a strong indicator of economic health. Preliminary GDP is released quarterly, usually at 11:00am CET. This often has an effect on prices during the European session.
- Harmonised Index of Consumer Prices (HICP): This is the primary measure of inflation in the Eurozone, reflecting price stability. Released monthly, typically around the 17th of the month, at 11:00am CET.
- Eurozone Unemployment Rate: Provides insight into the labour market across the Eurozone, with high unemployment rates typically being negative for the euro. Released monthly, typically at the beginning of the following month, at 11:00am CET.
- German IFO Business Climate Index: As Germany is the largest economy in the Eurozone, this survey provides valuable insights into business sentiment and economic conditions. Released monthly, around the 24th of the month, at 10:00am CET.
3. Japanese Yen (JPY)
Fundamental analysts watching the yen pay attention to several key economic indicators in Japan:
- Bank of Japan (BoJ) Interest Rate decisions: The BoJ’s stance on interest rates, particularly in its approach to maintaining low or negative rates, is critical for JPY valuation. The BoJ meets eight times a year, with announcements typically released overnight, often between 11:00pm and 2:00am Japan Standard Time (JST).
- Gross Domestic Product (GDP): Japan’s GDP is an essential indicator of economic strength, impacting the yen’s value. Released quarterly, with the preliminary report usually at 8:50am JST.
- Consumer Price Index (CPI): The CPI measures inflation and is closely watched, especially in the context of Japan’s long-standing battle with deflation. Japan’s CPI figures are typically released around the 20th of each month. However, the exact date can vary slightly depending on the calendar and scheduling by the Ministry of Internal Affairs and Communications, which is responsible for publishing the data.
- Trade Balance: Japan’s economy is export-driven, so the trade balance (difference between exports and imports) is a key economic indicator. Released monthly, usually around the 20th of the month, at 8:50am JST.
- Tankan Survey: A quarterly survey of business sentiment conducted by the BoJ, it offers insights into the outlook of Japan’s manufacturing and non-manufacturing sectors. Released quarterly, typically at 8:50am JST.
4. British Pound (GBP)
For the British pound, fundamental analysts monitor several important reports from the UK:
- Bank of England (BoE) Interest Rate decisions: The BoE’s decisions on interest rates directly influence the value of the pound and are closely monitored by forex traders. The BoE’s Monetary Policy Committee meets every six weeks, with decisions announced at 12:00pm GMT.
- Gross Domestic Product (GDP): The overall economic output of the UK, GDP figures are crucial for determining the strength of the pound. Preliminary GDP is released quarterly, typically at 7:00am GMT.
- Consumer Price Index (CPI): This report measures inflation, which impacts the purchasing power of the pound. Released monthly, usually around the 17th of the month, at 7:00am GMT.
- Unemployment Rate: A critical indicator of economic health, the unemployment rate can influence the pound’s value. Released monthly, usually around 7:00am GMT, covering the previous three months.
- Retail Sales: As a measure of consumer spending, retail sales are important for gauging the health of the UK economy. Released monthly, typically around the 19th of the month, at 7:00am GMT.
5. Swiss Franc (CHF)
For the Swiss franc, the following economic reports and announcements are vital:
- Swiss National Bank (SNB) Interest Rate decisions: The SNB’s monetary policy decisions are crucial for the CHF’s value, particularly given Switzerland’s status as a safe-haven currency. The SNB meets quarterly, with decisions usually announced at 9:30am Central European Time (CET).
- Gross Domestic Product (GDP): Switzerland’s GDP figures are a significant indicator of economic strength. Released quarterly, typically at 7:45am CET.
- Consumer Price Index (CPI): As a measure of inflation, the CPI influences the purchasing power of the Swiss franc. Released monthly, usually around the 5th of the month, at 8:30am CET.
- Trade Balance: Like Japan, Switzerland is an export-driven economy, so the trade balance is closely watched. Released monthly, typically around the 20th of the month, at 8:00am CET.
- KOF Economic Barometer: This is an indicator of the future direction of the Swiss economy, based on a variety of economic data. Released monthly, around the end of the month, at 9:00am CET.
6. Australian Dollar (AUD)
For the Australian dollar, fundamental analysts focus on key reports and announcements from Australia:
- Reserve Bank of Australia (RBA) interest rate decisions: The RBA’s decisions on interest rates are pivotal for the AUD, influencing borrowing costs and economic activity. The RBA meets on the first Tuesday of each month (except January), with decisions announced at 2:30pm Australian Eastern Standard Time (AEST).
- Gross Domestic Product (GDP): Australia’s GDP figures are crucial for assessing economic health and currency strength. Released quarterly, typically at 11:30am AEST.
- Consumer Price Index (CPI): This report measures inflation and impacts the purchasing power of the AUD. Released quarterly, usually around 11:30am AEST.
- Employment change and Unemployment Rate: These labour market indicators are significant for the Australian economy and, by extension, the AUD. Released quarterly, usually around 11:30am AEST.
- Trade Balance figures: Australia’s trade balance, particularly with China (its largest trading partner), is a key economic indicator. Released monthly, usually around the 15th of the month, at 11:30am AEST.
- Commodity prices: Given Australia’s reliance on commodity exports, changes in global commodity prices have a substantial impact on the AUD. Commodity prices naturally fluctuate throughout the month, so there is no one special day to look out for announcements.
By keeping a close eye on these reports and announcements, you can better understand and anticipate potential movements in the forex market related to these major currencies.
Use charting news alerts to keep you up-to-date
In most charting programs there is a ‘news alerts’ feature, which issues an alert when major economic news is expected.
In the example below for the USD/JPY, clicking on the alert which shows the US flag indicates the minutes of a FOMC meeting are expected.


Getting to know which pieces of financial news are important for the currency pair you’re trading is a vital part of your education as a forex trader.
By clicking on the alerts located at the base of your trading chart, you’re able to see which news event or announcement is expected.
In this way, you can keep an eye on fundamental analysis reports and statistics which may affect price action.

Technical Analysis
Technical analysis involves examining price charts to identify patterns and trends.
Forex traders use historical price data to predict future price movements, relying on the idea that market price action history tends to repeat itself over and over again.
These are the elements of technical analysis that forex traders rely on:
Price charts
These are visual representations of an asset’s price over time. Common chart types include:
- Line charts: A single line connects closing prices
- Bar charts: Shows the open, high, low, and closing prices for each time period in a simple bar
- Candlestick charts: Similar to bar charts but with price action represented by candlesticks
Candlestick patterns
Candlestick chart patterns, like head and shoulders or double tops and bottoms, play the largest and most significant part of technical analysis.
Candlestick patterns offer a visual representation of market sentiment, and warn of potential price reversals.
Support and resistance levels
Technical analysts identify key support and resistance levels. These are price points where a currency pair has historically struggled to break through. These levels are critical for setting stop-loss orders and take-profit targets.
Best indicators and oscillators
Forex traders employ various technical indicators, such as moving averages, the Relative Strength Index (RSI), the Supertrend indicator and Bollinger Bands, to determine potential entry and exit points.
These indicators help to identify overbought or oversold conditions, trend reversals, and market momentum.
The field of technical analysis is a vast one, and some academics spend a lifetime studying different techniques.
However, here at MarketMates we like to keep our technical analysis fairly simple.
For our forex trading, we use:
- Candlestick charts in a five-minute, 15-minute, one-hour and daily timeframe
- Bollinger Bands over basic price action
- The Market Type indicator
- The Bollinger Band breakout indicator
- The Bollinger Band Relative Width indicator
These last three indicators are ones that we have formulated ourselves here at MarketMates.
However, we are happy to share these indicators with you if you use the TradingView charting software package.
You can access our FREE indicators here.
Below is a typical chart set-up showing simple price action on a candlestick chart, Bollinger Bands, the Relative Width indicator and the Market Type indicator displayed.


If you wish to know all about how to read trading charts, and their importance to forex traders, you can read all about Candlestick Chart Patterns here.
Final thoughts
Most successful forex traders use a combination of technical and fundamental analysis to make informed trading decisions.
By understanding the broader economic picture through fundamental analysis, and then fine-tuning entry and exit points with technical analysis, traders can develop a robust trading strategy that balances both short-term and long-term considerations.
Both technical and fundamental analysis have their strengths and weaknesses.
While technical analysis offers an immediate insight into price action, suitable for short-term trading, fundamental analysis provides a deeper understanding of the economic forces driving currency values.
By combining these two approaches, you can maximise your ability to predict market movements and make more informed trading decisions.
If you wish to understand more about how the forex market works, my colleague Sam Eder has written a series all about this subject.
Till next time, happy trading!

If you like this article then sign-up for our newsletter or join over 42,000 traders and get The Advanced Forex Course for Smart Traders 2.0. It’s 100% free.
Sources
Marketmates uses only high-quality sources, including peer-reviewed studies, to support the facts within our articles. Read our editorial guidelines to learn more about how we fact-check and keep our content accurate, reliable, and trustworthy.
- Wikipedia: John Maynard Keynes https://en.wikipedia.org/wiki/John_Maynard_Keynes
- Wikipedia: Munehisa Homma https://en.wikipedia.org/wiki/Honma_Munehisa


