


Candlestick patterns are one of the most useful tools for understanding price action in forex trading. This beginner-friendly guide explains how candlesticks work, what common patterns mean, and how traders use them in real market conditions.
Completely new to forex? Start with our Forex Trading Beginner’s Guide first.
Quick take:
- Candlestick patterns help traders understand buyer and seller behaviour.
- The best patterns for beginners include engulfing candles, hammers, shooting stars, and dojis.
- Candlestick patterns work best when combined with trend, support and resistance, and risk management.
Candlestick Patterns for Beginners: 7 Must-Know Forex Candles
Understanding candlestick patterns is one of the most important skills in forex trading. Candlesticks help traders understand market psychology, identify potential reversals, and spot trading opportunities directly from the chart.
Whether you are trading trends, breakouts, or reversals, candlestick patterns are widely used by traders to help make trading decisions.
Why Candlestick Patterns Matter
Candlestick patterns are popular because they provide a simple visual way to understand:
- Buyer strength
- Seller strength
- Market momentum
- Reversals
- Trend continuation
- Market indecision
Instead of just looking at price moving up or down, candlesticks help traders understand how price is moving and who is controlling the market.
This is why candlestick analysis is commonly used in forex trading, stock trading, cryptocurrency trading, and commodity trading. Even professional traders still use candlestick analysis as part of their overall trading strategy.
Quick Summary of Important Candlestick Patterns
| Pattern | Signal Type | Bias | Common Use |
|---|---|---|---|
| Bullish Engulfing | Reversal | Bullish | Near support |
| Bearish Engulfing | Reversal | Bearish | Near resistance |
| Hammer | Reversal | Bullish | After downtrend |
| Shooting Star | Reversal | Bearish | After uptrend |
| Doji | Indecision | Neutral | Potential reversal |
| Morning Star | Reversal | Bullish | Trend exhaustion |
| Evening Star | Reversal | Bearish | Trend exhaustion |
What Is a Candlestick?
A candlestick is a visual representation of price movement over a specific period of time.
Each candlestick shows:
- Opening price
- Closing price
- Highest price
- Lowest price

Parts of a Candlestick
 Body
The body represents the distance between the opening and closing price.
 Upper Wick
The upper wick shows the highest price reached during the time period.
 Lower Wick
The lower wick shows the lowest price reached during the time period.
Bullish vs Bearish Candles
Bullish Candle
A bullish candle forms when the closing price is higher than the opening price.
This suggests buyers controlled the market, price moved upward, and bullish momentum may be increasing.

Bearish Candle
A bearish candle forms when the closing price is lower than the opening price.
This suggests sellers controlled the market, price moved downward, and bearish momentum may be increasing.

The Most Important Candlestick Patterns for Beginners
Rather than trying to memorise dozens of patterns immediately, beginners should focus on learning a small number of high-quality patterns first.
The goal is not memorisation. The goal is understanding market psychology, momentum, and buyer and seller behaviour.
Bullish Engulfing Pattern
A bullish engulfing pattern occurs when a bearish candle is followed by a larger bullish candle that completely engulfs the previous candle.
This pattern suggests buyers have taken control, selling pressure may be weakening, and a bullish reversal could occur.
What it tells traders: Sellers initially pushed price lower, but buyers entered aggressively and completely reversed the previous candle’s movement.
Best conditions:
- Near support
- After a downtrend
- With strong bullish momentum
- When higher timeframes support the setup
Common beginner mistake: Trading every engulfing candle without checking trend, support and resistance, or confirmation.

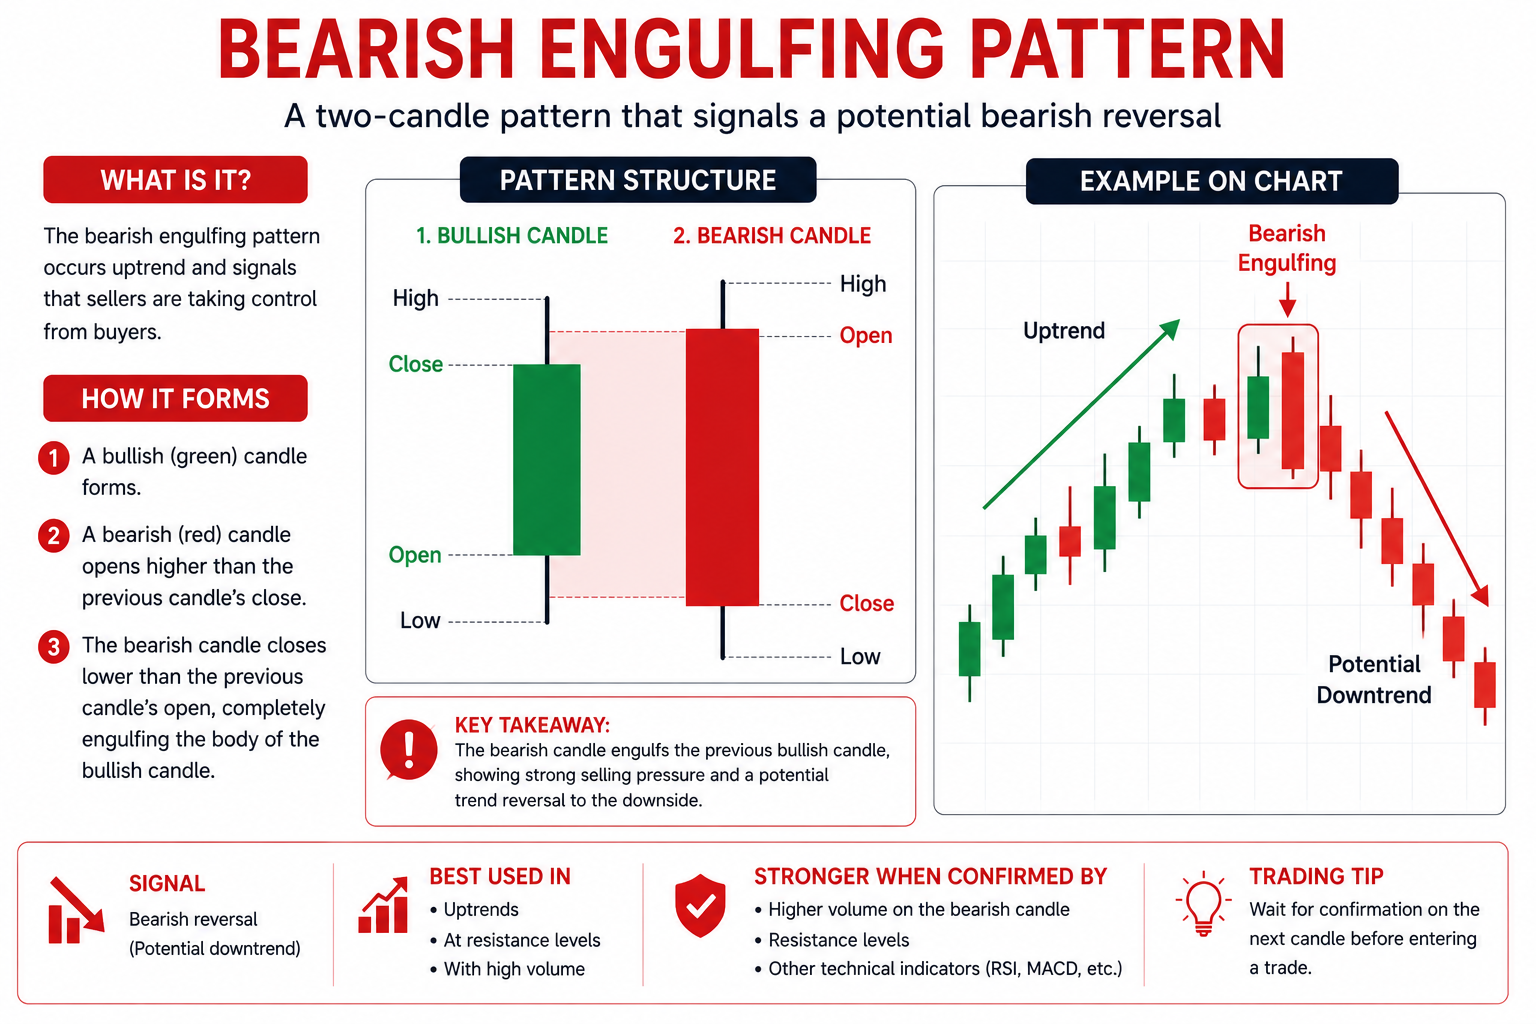
Bearish Engulfing Pattern
A bearish engulfing pattern is the opposite of a bullish engulfing pattern. It occurs when a bullish candle is followed by a larger bearish candle that completely engulfs the previous candle.
This may suggest buyers are losing control, sellers are becoming stronger, and bearish momentum is increasing.
Best conditions:
- Near resistance
- After a strong rally
- When price is overextended
- When momentum begins to weaken
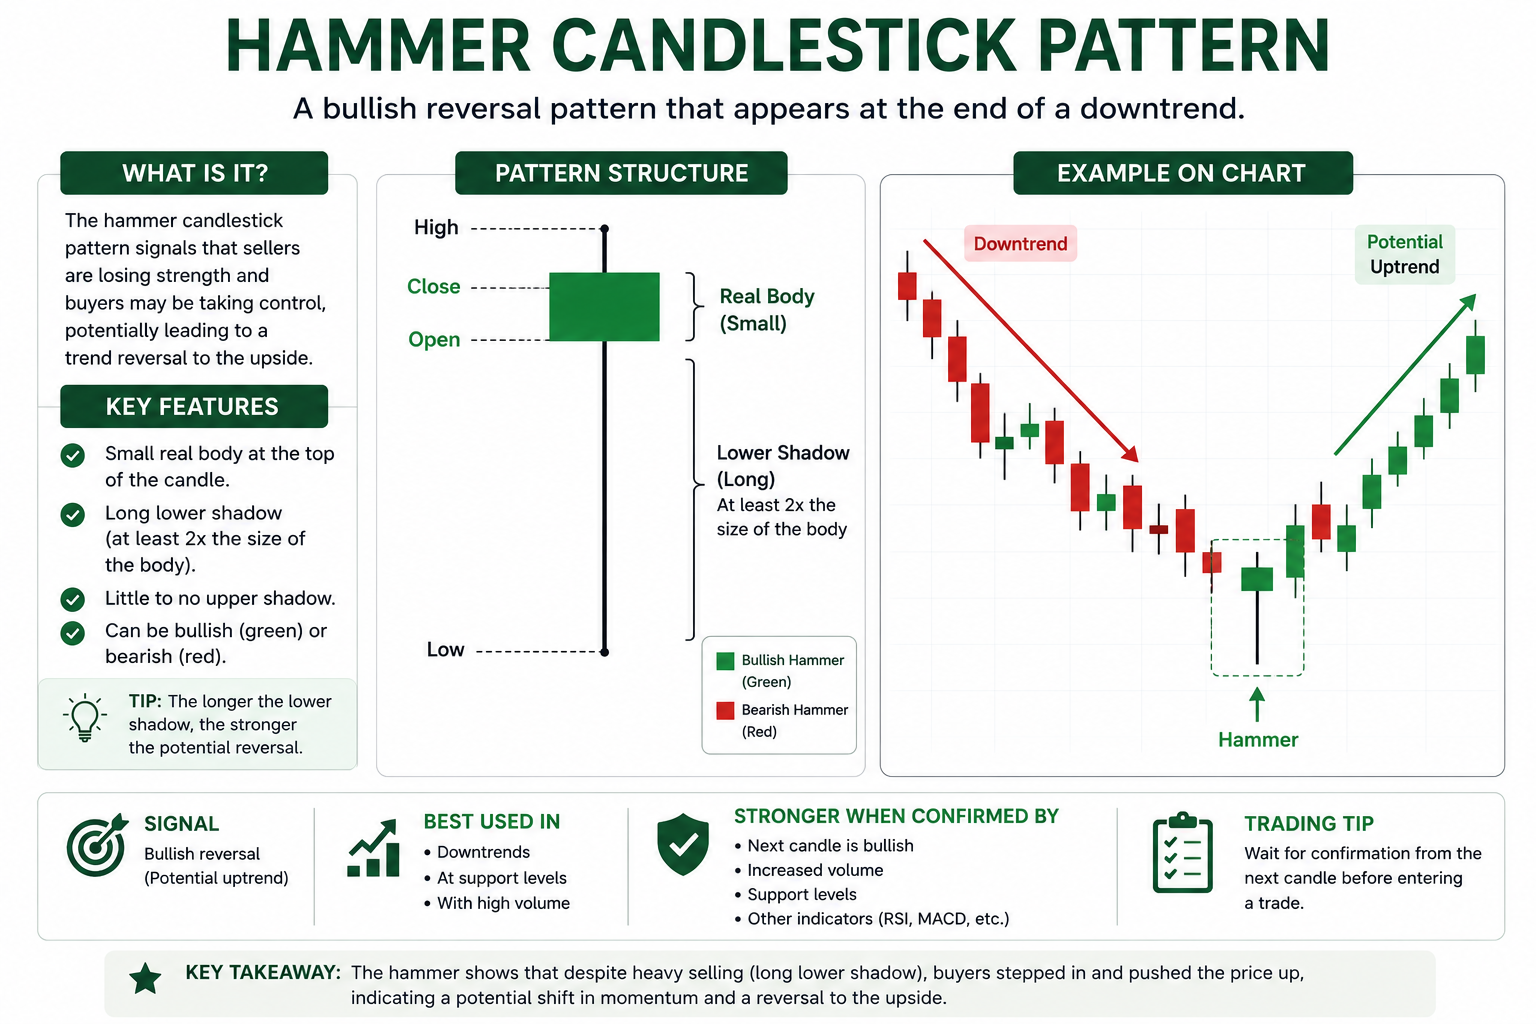
Hammer Candlestick Pattern
The hammer is one of the most popular bullish reversal patterns. It usually has a small body, a long lower wick, and little or no upper wick.
The long lower wick shows sellers initially pushed price lower, but buyers eventually regained control and forced price back higher before the candle closed.
Best conditions:
- After a decline
- Near support
- When the market shows exhaustion
- With other bullish signals
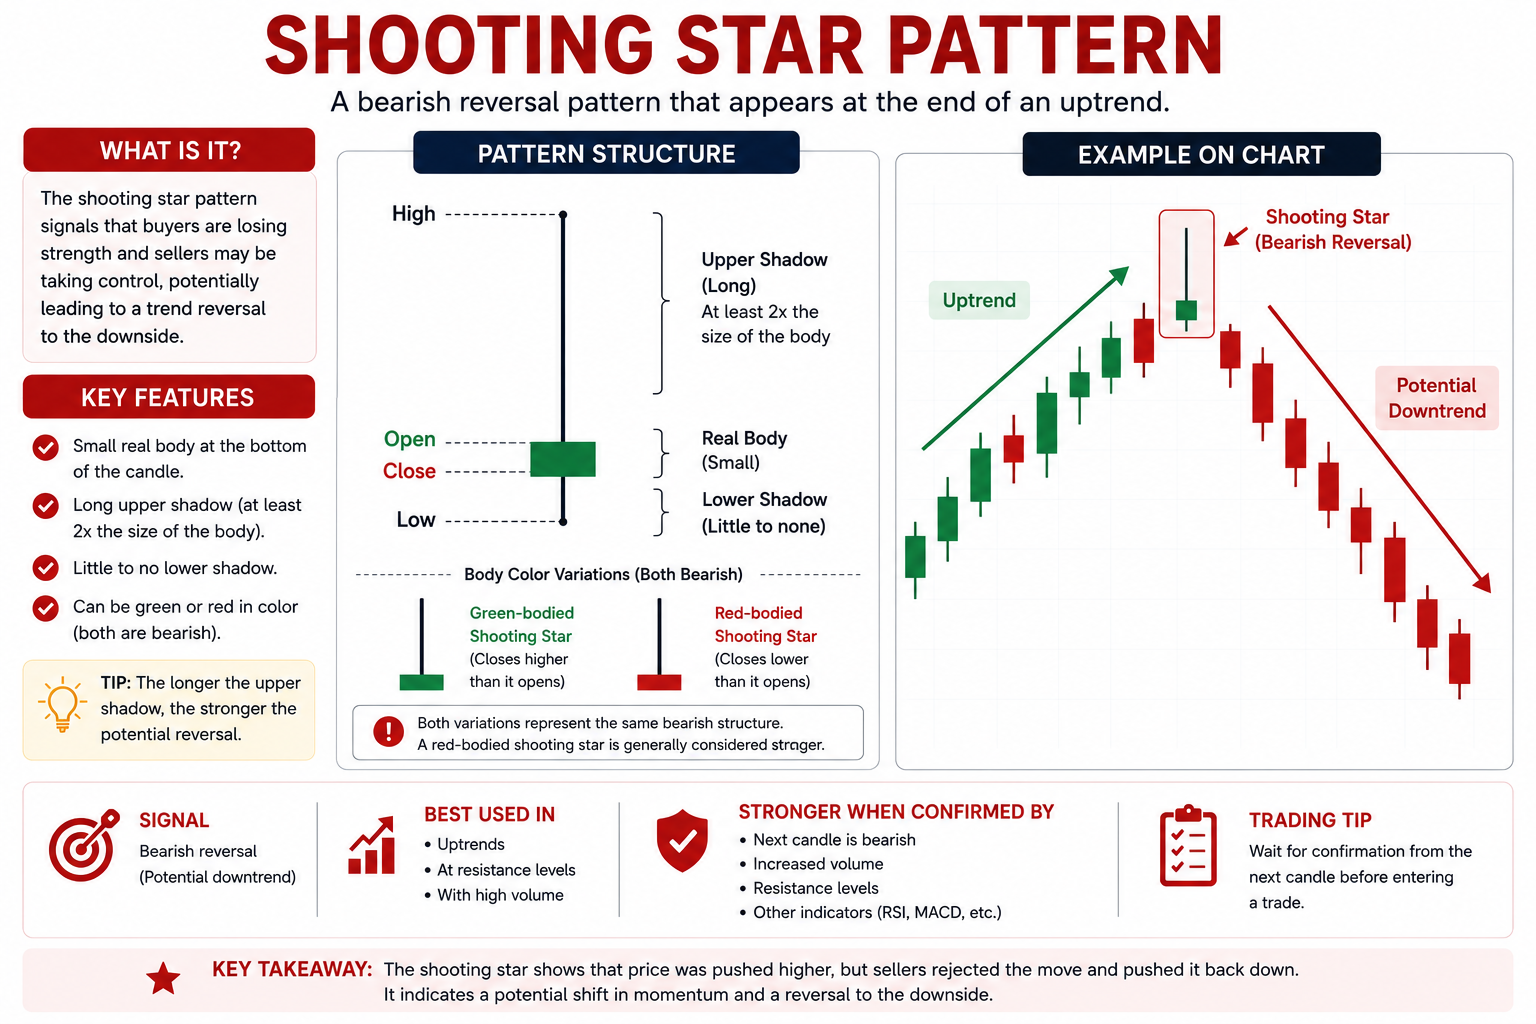
 Shooting Star Pattern
The shooting star is a bearish reversal candlestick pattern. It typically has a small body, a long upper wick, and little or no lower wick.
Buyers initially pushed price higher, but sellers entered and forced price back down before the candle closed.
Best conditions:
- After strong rallies
- Near resistance
- When market momentum begins slowing
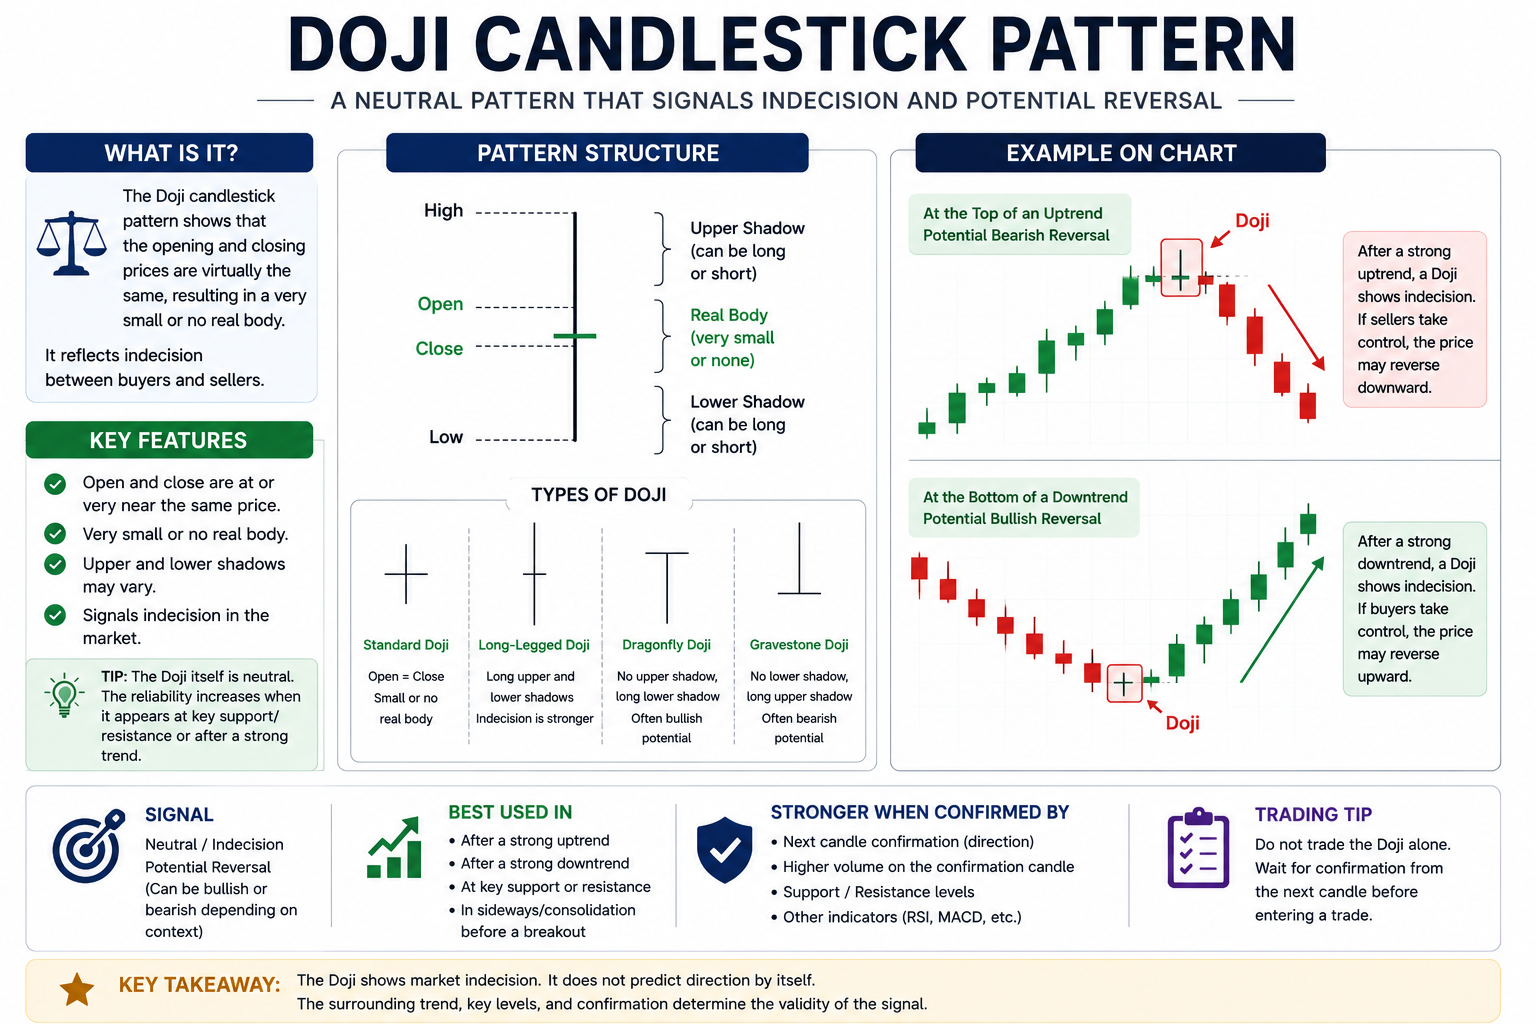
 Doji Candlestick Pattern
A doji forms when the opening and closing prices are very close together. This creates a very small body, often with upper and lower wicks.
A doji represents market indecision. Neither buyers nor sellers fully controlled the market during that period.
Doji candles become more important when they appear:
- Near support or resistance
- After strong trends
- Before breakouts
- During volatile conditions
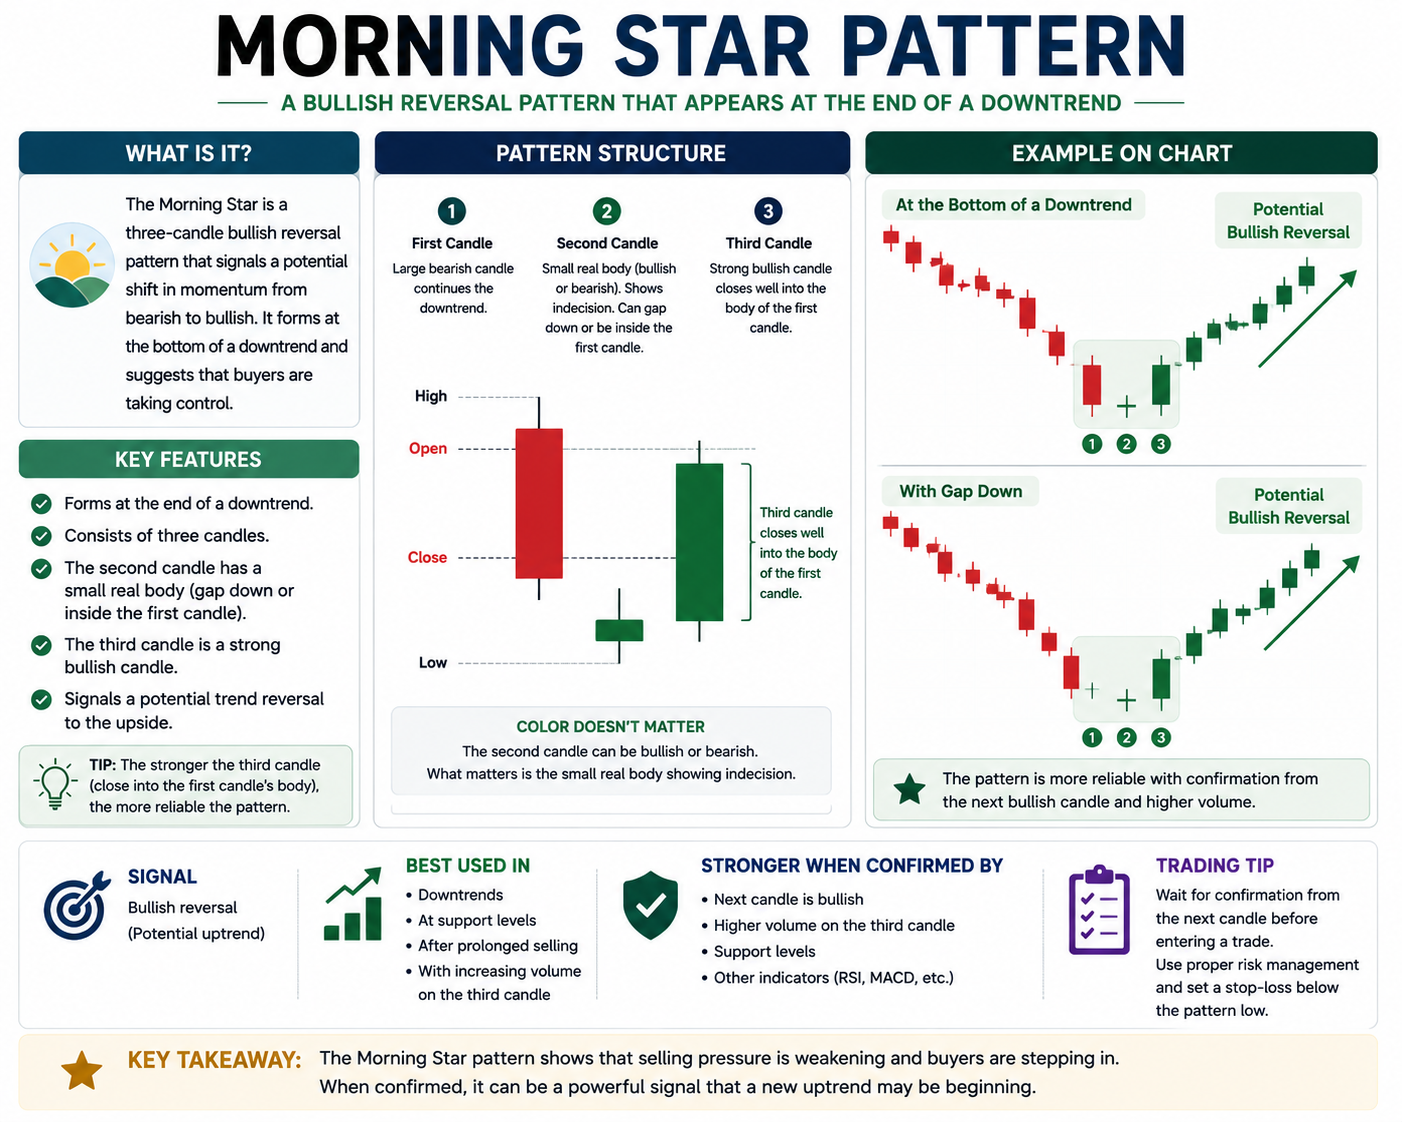
 Morning Star Pattern
The morning star is a bullish reversal pattern made up of three candles: a strong bearish candle, a small indecision candle, and a strong bullish candle.
This pattern often signals weakening bearish momentum, growing buyer strength, and a potential trend reversal.
 Evening Star Pattern
The evening star is the bearish opposite of the morning star. It typically consists of a strong bullish candle, a small indecision candle, and a strong bearish candle.
This may suggest buyer exhaustion, slowing bullish momentum, and a possible bearish reversal.

How to Actually Use Candlestick Patterns
One of the biggest mistakes beginners make is relying only on candlestick patterns. Professional traders rarely trade a candle pattern by itself.
Instead, candlestick analysis is usually combined with:
- Trend analysis
- Support and resistance
- Risk management
- Market structure
- Trading strategies
Important: Candlestick patterns are tools, not guaranteed signals. They become more useful when combined with market context and proper risk management.
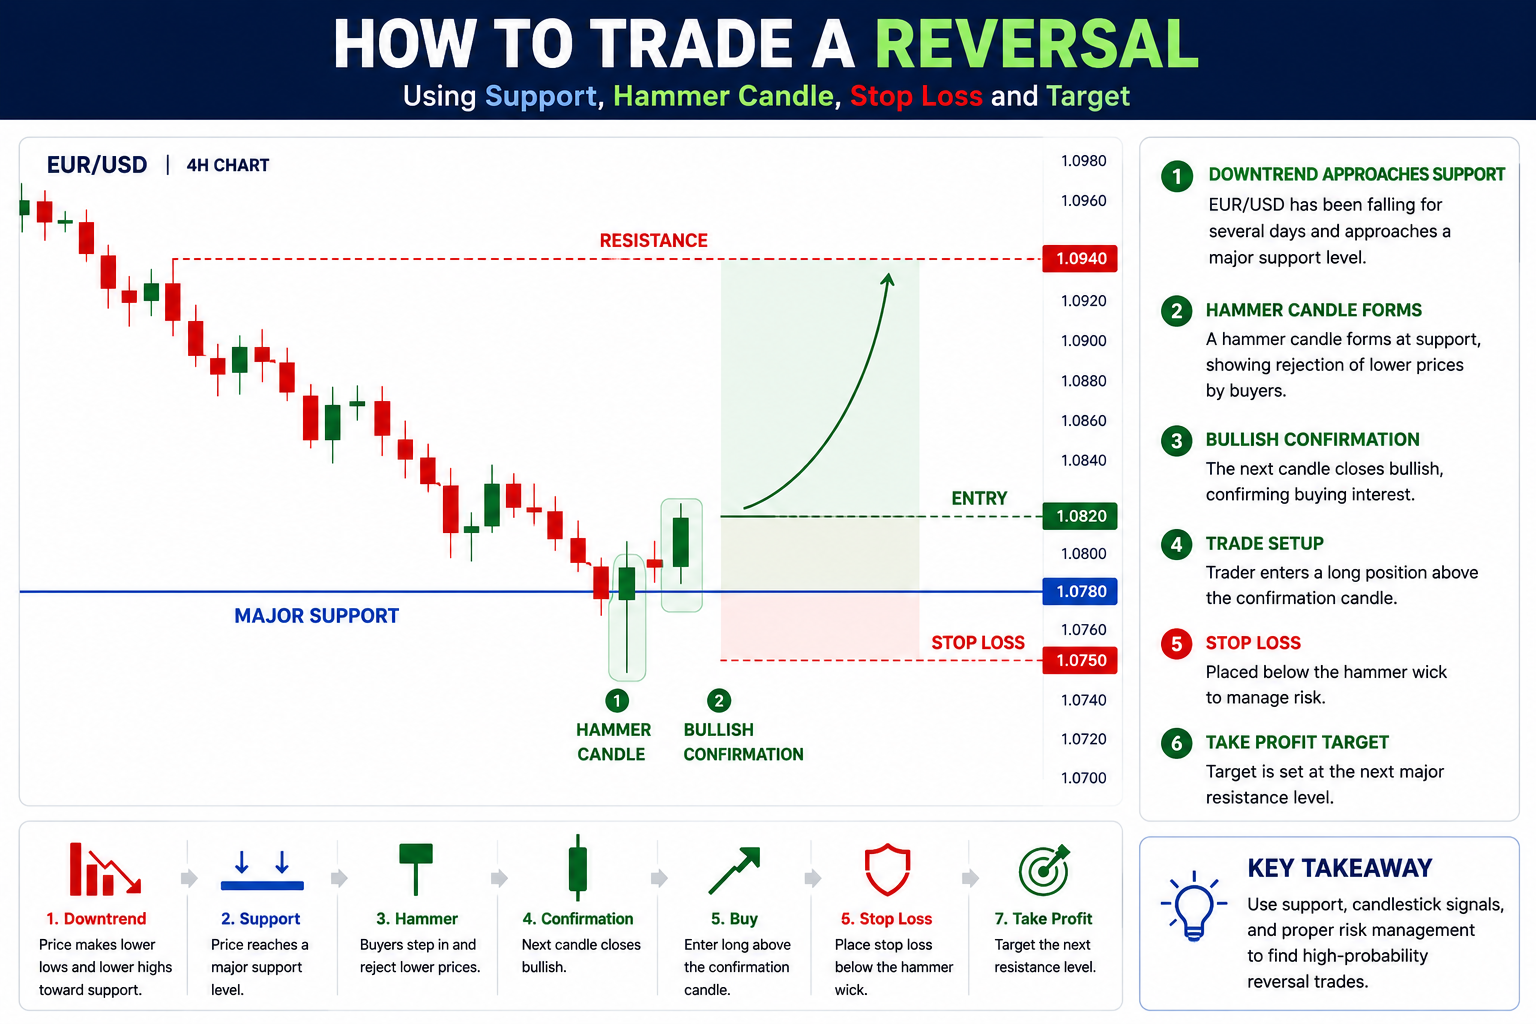
Example of Practical Candlestick Analysis
Imagine EUR/USD has been falling for several days and approaches a major support level.
Then:
- A hammer candle forms
- Buyers reject lower prices
- The next candle closes bullish
A trader may interpret this as potential reversal conditions and may choose to enter a long trade, place a stop-loss below the hammer wick, and target the next resistance level.
Common Beginner Mistakes
Trading Every Pattern
Not every candlestick pattern is worth trading. Quality matters more than quantity.
Ignoring the Overall Trend
A bullish pattern inside a strong downtrend may have lower probability. Trend context matters.
Trading Without a Stop Loss
Even strong-looking setups can fail. Risk management is essential.
Entering Too Early
Many beginners jump into trades before confirmation appears. Patience is important.
Ignoring Market Conditions
Candlestick patterns behave differently in trending markets, ranging markets, and volatile news environments.
Best Candlestick Patterns for Beginners
If you are just starting, focus on mastering a small number of simple patterns first.
- Bullish engulfing
- Bearish engulfing
- Hammer
- Shooting star
- Doji
Candlestick Patterns vs Trading Strategies
Candlestick patterns are only one part of trading.
A candlestick pattern tells you what price may be doing right now. A trading strategy tells you how to manage the entire trade, including entries, stop losses, take profits, risk management, and position sizing.
Ready to practise candlestick patterns in the market?
Open a free account and start applying what you’ve learned in a real trading platform environment without risking real money.
Frequently Asked Questions
Are candlestick patterns reliable?
Candlestick patterns can be useful tools, but they are not guaranteed signals. Their effectiveness often depends on market conditions, trend context, support and resistance, and risk management.
Which candlestick pattern is best for beginners?
Many beginners start with bullish engulfing, bearish engulfing, and hammer patterns because they are easier to recognise visually.
Do professional traders use candlestick patterns?
Yes. Many professional traders still use candlestick analysis as part of their trading process, usually together with broader market analysis.
Can candlestick patterns be used alone?
Most experienced traders combine candlestick patterns with trend analysis, support and resistance, risk management, and trading strategies rather than relying on patterns alone.
Which timeframe works best for candlestick trading?
Candlestick patterns can appear on any timeframe. However, higher timeframes often produce stronger signals, while lower timeframes may contain more market noise.
Final Thoughts
Candlestick patterns are one of the most useful tools for understanding market behaviour.
However, successful trading is not about memorising hundreds of patterns. Instead, focus on learning a few patterns properly, understanding the psychology behind them, practising on live charts, and combining them with risk management.
Over time, you will begin recognising how price behaves in different market conditions. That experience is what helps traders improve.
Learn how traders use candlestick patterns inside complete strategies
Now that you understand the basics of candlestick patterns, the next step is learning how traders combine them into complete trading systems.
Read 9 Must-Learn Forex Trading Strategies
Start with the Forex Beginner Guide


