


After you get into your trade, different things happen. Very rarely does your trade go in a straight line to your profit objective.
If you only have one tool in your toolbox, you will struggle to react effectively to what is happening in front of you.
If you only have a hammer, everything looks like a nail, even when your trade is screaming for a screwdriver or a tape measure.
Instead, pack your toolbox full of different tools for different scenarios.
That way, you can make the right decisions about when to stay in your trade and when to exit based on what the market is doing at the time.
Simple entries, complex exits
My years of forex trading have taught me that trade entries should be kept simple, but exits should be complex.
You need a simple entry to be decisive, and complex exits to adapt to the different things that happen once you enter your trade, and to ensure some big winning trades.
What this means is you will have multiple rules for exiting a trade.
These exit rules allow you to adapt to the market conditions and make your trading more consistent.
Here is an example of what a complex exit strategy looks like from the example trading strategy we use in this course:
| Exit rules | |
|---|---|
Exit rule #1 | Place a profit target at 30-pips on 1/3 of my trade |
Exit rule #2 | Place a profit target at 50-pips on 1/3 of my trade |
Exit rule #3 | Place a profit target at 80-pips on 1/3 of my trade |
Exit rule #4 | Exit if conditions become overbought or oversold and start to reverse |
Exit rule #5 | Place a trailing stop on the Supertrend indicator |
Exit rule #6 | Exit any open trades at the end of the day |
Here is what the exits look like on the chart.


Different exit strategies for changing market conditions
In developing your complex exit strategy, it is important to understand market types.
As Market Wizard Michael Carr says:
“Don’t worry about what the markets are going to do, worry about what you are going to do in response to the market.”
By understanding market types, you can apply the right exit strategy to the market type.
For example:
- a bull normal market will often transition to a bull volatile
- a bull volatile market will often develop into a volatile sideways phase
- a sideways volatile settles into a sideways normal and then sideways quiet
- a sideways market type then turns into a new bull or bear normal market type
If you know this is the probable way the price action will move, you can plan your exits accordingly.
Find out more about these patterns, and what to expect next, in our lesson on the subject of different market types.
Dividing your trade into separate portions
I suggest breaking your trade into multiple parts and applying a different exit rule to each one.
In his fantastic book, Trading in the Zone, Mark Douglas suggests that you should break your trades into three parts.
You:
- take some profit early, when the market makes some available
- take some more at your main target
- leave the rest for a big winning trade
This is wise advice, and I follow it every time I trade.
Market Wizard Jimmy Balodimas said:
“I always take money off the table when it’s in my favor. Always, always, always.”
Fellow Market Wizard Scott Ramsey suggests you:
“Never sell the strongest markets until they fail.”
By scaling out using the above three-part method you get to follow both these pieces of advice.
How many portions should I split my trade into?
I’d suggest between three and five portions is ideal.
This provides a good balance of flexibility without overcomplicating things.
Here is an example of a trade with multiple exits, assuming:
- a 15-pip stop
- one target at 45 pips
- one target at 75 pips
The final portion of the trade is on a trailing stop.
A multiple-exit strategy example
- Action 1: At the 45-pip profit target (3R), you exit 1/3 of your trade to lock in some initial profit
(I would suggest moving the stop to breakeven at this point)
- Action 2: At the 75-pip profit target (5R), take profit on a second third of your trade
- Action 3: Your trailing stop-loss point gets the final third of your trade out for a 150-pip profit
Comparison between multi-exit strategy and single-exit strategy
Let’s look at how this multi-exit strategy compares to a single-exit strategy with a simple trade comparison:
Trade details:
- 1 standard lot of 100,000
- Stop-loss of 15-pips
- 1R on the trade is $100
Exit strategy 1:
Exit the entire position once a profit of 45-pips (3R) has been reached
Result: 45-pip profit, or 3R = profit of $300
Exit strategy 2:
A three-part exit strategy
- exit one-third at 45-pip target
- exit one-third at 75-pip target
- exit one-third after 150-pips based on the trailing stop
Result: Avg 90-pips, or 6R = $600 profit
Overall, by dividing the trade into three portions, and closing them one at a time (based on different exit triggers) trade profit has been doubled.
However, there are other benefits too:
- the risk of losing all profit if the price suddenly tanks is eliminated
- because you take some profit when the 45-pip target is reached, and you have moved your stop to break even, you are guaranteed a profit from the trade, so psychologically, you’re already a winner
(This will give you confidence to continue your winning exit strategy, and not get out of the trade too quickly.)
- by using more than one of your exit tools, you’ve ridden the uptrend, only getting out when the trend reverses
Exit strategies that will work for you
These are some of the different reasons for exiting a winning trade I use in my trading:
- Profit targets: Exits based on different profit targets
- Trailing stops: Using trailing stops based on indicators
- Overbought or oversold markets: exits based on overbought or oversold indicator signals
- Price action exits: Exits based on price action reversal patterns
- Scheduled news events: Taking profits either before or after news events
- Trading session exits: Taking profit at different times of day based on trading session open and closes
- Extreme exits: These are for when you get rapid directional moves during trades
Profit targets
In the past, I would trade without profit targets, hoping every trade would turn into a giant winner.
Over time, I realised the value of taking profits on part of my position, as it made my trading more consistent.
There are two main ways of setting profits that work for me.
- Fixed targets
- Support and resistance targets
There are other methods that you can use such as Fibonacci levels, but I don’t use them, so they won’t be covered here.
Whatever you use, the main principle to remember is you need to ensure the target is several R multiples away so you have superior risk/reward on your trades.
Fixed targets
Fixed targets are based on a number of pips or a certain multiple of the Average True Range (ATR.)
For three years I day-traded successfully with fixed targets varying from 30 to 100 pips.
Now I prefer to use ATR-based targets as they automatically adjust for market volatility, and line up nicely with ATR-based stop-losses.
Here is an example of ATR-based targets.


In our ‘ATR Multiple indicator’ for TradingView, we have calculated different targets based on the ATR multiple.
You can get this unique indicator for free here.
I put a different target on each portion of my trade, ranging from 3R-10R, and then one portion with no profit target.
Support and resistance targets
Another way of setting targets is using support and resistance levels to identify where to take profit.
In forex trading, price tends to move towards support and resistance levels.
This is because a large number of orders are placed at these levels, so if the large bank traders want to execute orders, this is the safest place for them to be.
It is about supply and demand.
Bank traders need to execute corporate orders, and don’t want to be stuck with a large order they can’t execute at a good price, so they need to be where the supply is.
This means by placing your target on support and resistance levels, your targets are always at market relevant levels.
Once you have identified a strong support or resistance level to use as a target, you can place the order to exit just ahead of the support or resistance level.
Here is an example:

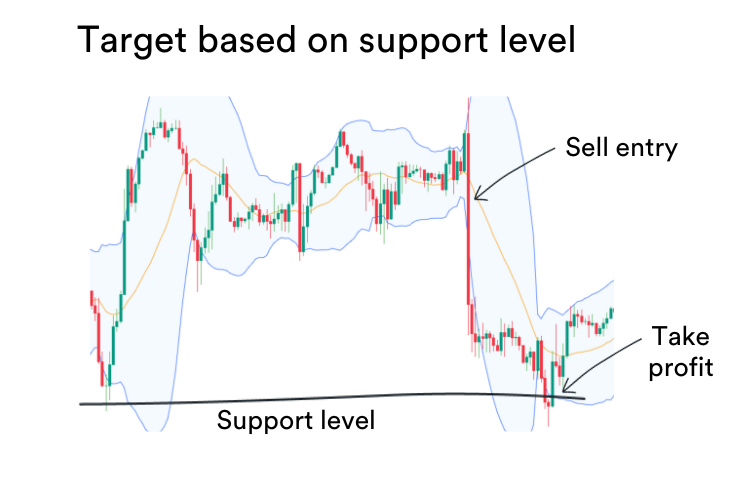
Make sure any level you use as a target makes sense from a risk/reward perspective.
What to do if the price almost hits your profit target
It can be frustrating for traders when a trade gets within a few pips of the target and then reverses.
How I deal with this is to set an alert for when the price gets within a few pips of the target.
The exact amount depends on the timeframe.
I will then move the stop an equal distance from the current price.
For example, if the price gets within 3-pips of my target I would put a stop 3-pips away from the current price.
This has saved me numerous times.
Trailing stops based on indicators
Over the long-term, the portion of the trade based on the trailing stop is likely to be the best performing.
This part of the trade best follows the idea of ‘let your profits run.’
Let’s look at two indicators you can use as trailing stops.
- Parabolic SAR indicator
- Supertrend indicator
Parabolic SAR
The Parabolic SAR indicator is a time and price tool used to identify reverses in price action.
The SAR part stands for ‘Stop and Reverse,’ and this gives you a hint as to what it’s useful for.
This indicator can help you see when a price reversal is happening, or about to happen.
Here’s an example of what the SAR looks like on a price chart:
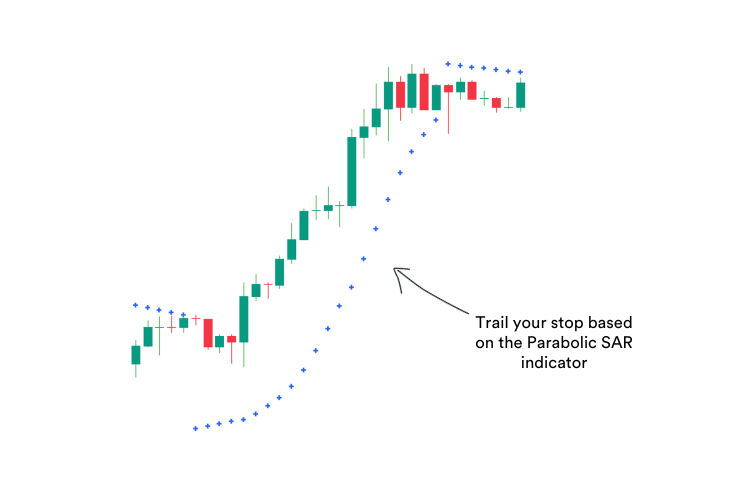

See how the blue dots are below price action in an uptrend, and above price action in a downtrend?
This indicator can be very useful for setting a trailing stop-loss, or determining when a direction change is coming, and it’s time to lock-in another portion of your profit.
I mention this indicator as a long-time student of Dr Van Tharp.
Systems trading expert Ken Long also uses this indicator.
Supertrend indicator
The indicator which I use personally use all the time as a trailing stop is the Supertrend indicator
It’s a trend-following indicator (based on the ATR) which combines trend detection with volatility.
In other words, it shows the direction of a trend, and how strong the directional push is.
This is what it looks like on your price chart:
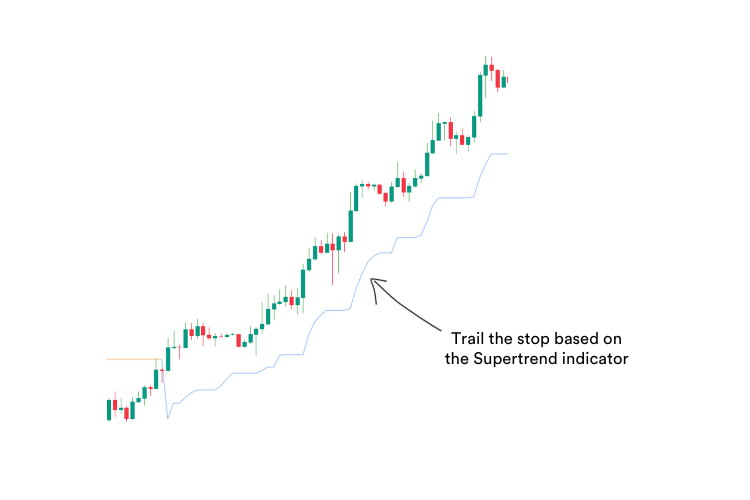

The Supertrend indicator can ‘give back’ a large amount of profits.
I borrow this philosophy from Market Wizard Richard Dennis, who believed that to have really large winners, you need to allow the trade room to move.
Of course, this is easier to do if you have already locked in some profits on other parts of the trade.
Take profit during overbought or oversold conditions
When the currency pair you are trading gets overbought or oversold, it is often a good time to take profits.
This is because the market is signalling to you that it is ready to reverse, which often happens after an extended or rapid move.
Here is an example:
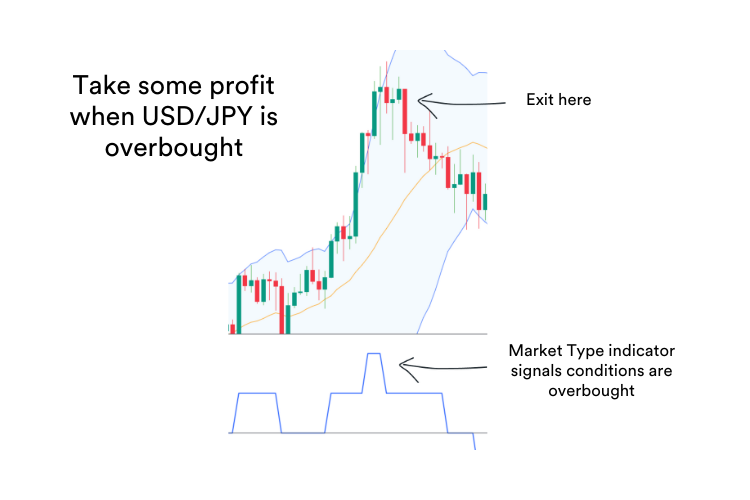

By happy accident, we found our Market Type indicator is a good way to identify and time these reversals.
The Market Type indicator combines Bollinger Bands and RSI to determine the market type.
We found that when the market type turns from bull or bear volatile, back into bull or bear, it is a signal that the market has been overbought or oversold, and is a good time to take some profit.
Price action reversals
Part of being a good trader is to trade what’s in front of you. Your rules should allow you to act when you see something on the charts.
This could be the formation of a reversal pattern, or another signal that price action is about to change direction.
Generally, you would want to see this reversal pattern in combination with another of your exit rules, such as a support or resistance level, or once the currency pair has become overbought or oversold.
Alternatively, you may decide to wait for a profit objective to be reached (such as 2R in profit) and then be willing to exit on the next reversal pattern that forms.
The most common reversal pattern I like to use is the formation of a double top or double bottom.
If the price fails to break to a new high or low after the second attempt and forms a reversal candlestick pattern,then I will take profit.
Here’s an example:


Having the discretion in my rules to trade these obvious reversals is an important part of my exit strategy. Because of this discretion, it does take practice to recognise the patterns and to be disciplined in waiting for them to properly form.
Handling exits around news events
News events can be your greatest source of profits or losses as a trader.
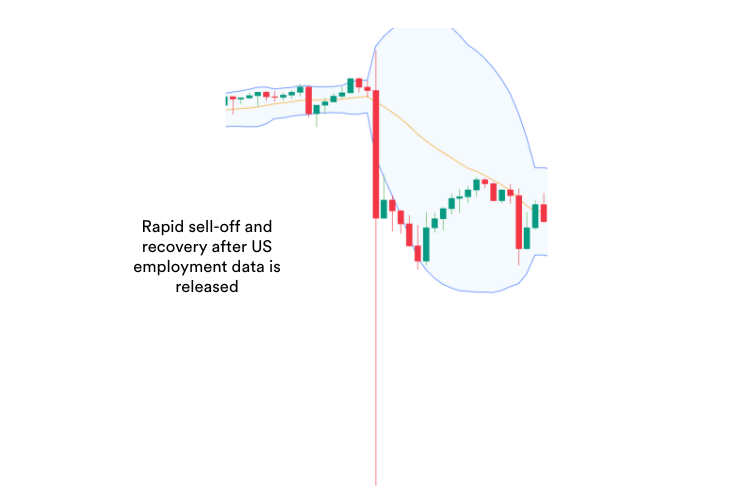
Often there is a rapid move after the news is announced. Sometimes this could go against you, while at other times, it can lead to a fast gain.
You need to plan how you will handle these scenarios.
The first consideration is whether to close your trade before the news event. This is the more prudent choice.
This is because there can be large amounts of slippage after a major news event, and you may end up exiting at a much worse price than you had planned. This won’t happen all the time, but there is the potential for a major loss if it is a high-impact event.
Secondly, if there is a profit, it can rapidly disappear. For this reason, I suggest you use targets, or close most of the trade 15 minutes after the event and use a tight trailing stop to protect the remainder of your position
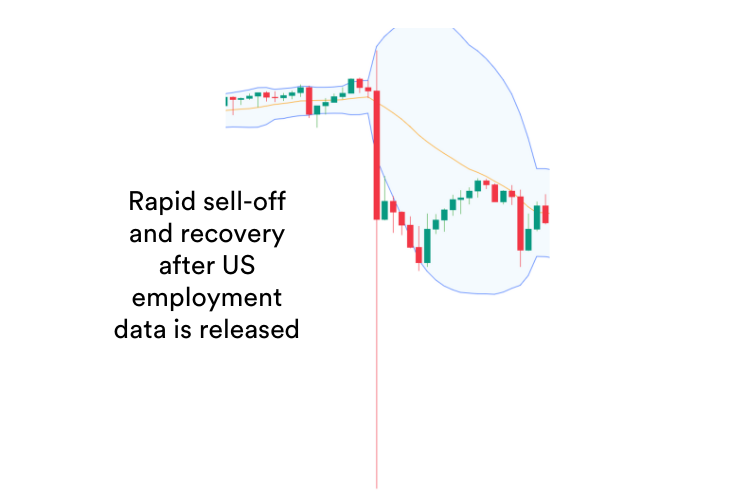
Here is an example of a news event and a rapid reversal.
I encourage you to record and monitor what happens to your positions around news events.
This can be done easily in TradingView by using the events feature in the settings, and ticking economic events and event breaks. Events will now be listed on your charts.


Over time, you will learn what sort of events will impact your positions and if they will do so in a positive or negative way.
Trading session exits
If you are day trading, the price action will reflect the activities of traders in the different trading sessions of Sydney, Tokyo, Frankfurt, London and New York.


You can see this clearly on the charts by the increases in volatility at the session opening times.
Often the price action will change direction after the start of these sessions. These moves can be rapid, quickly wiping out gains or triggering stops
If you are in profit before a session commences, it can pay to either close your trade or watch the price action closely for signs of a reversal.
Note that sometimes session opening can coincide with news which can further increase volatility and the likelihood of a sudden change of direction.
Additionally, consider closing your position ahead of the weekend when there is the risk of a price gap. If you are doing so, it’s prudent to take action early in the US trading session as the spreads can increase later in the day ahead of the weekend close.
How to take profit during extreme market types
The markets can react quickly and dramatically to major news events.
Many of us will remember for years where we were when certain dramatic news events shook the world.
Do you remember where you were when the COVID pandemic was first declared, and nations started closing their borders?
Or when there was a major presidential election announcement? Or BREXIT results were announced?
Some news events can be foreseen, such as bank policy announcements and economic data releases.
However, other events, such as natural disasters, political instability or major geo-political events, may catch us by surprise.
While these events are rare, if you do end up with a large move in your favour due to a major event, then be prepared to take profit.
This is because these rapid moves can just as rapidly reverse.
As Market Wizard William Eckhart says:
“The sharpness of the move indicates that volatility has just increased; hence, even a windfall profit might dissipate rapidly.”
Market Wizard Michael Marcus takes a similar view:
“One of my rules was to get out when the volatility and momentum became absolutely insane.”
To do this you can set a tight trailing stop, such as one to three times the ATR from the market price on the majority of your remaining position.
It can be good to leave a very small portion of the trade to run without a tight stop, just in case the move ends up going only one way.
Put your energy into exits
Failure to focus on exits results in traders committing these cardinal trading sins:
- taking profits too early and cutting winners short
- letting winning trades turn into losses
Instead, you want to have an exit strategy that:
- lets you adapt to changing market conditions
- allows you to capture profits regularily
- keeps you in the trade for some big wins
So spend a good amount of time on this lesson – it’s more important than your set-up or entry.
In the next lesson, you’re going to learn how to write and test your rules-based plan.
See you there.

Sources
Marketmates uses only high-quality sources, including peer-reviewed studies, to support the facts within our articles. Read our editorial guidelines to learn more about how we fact-check and keep our content accurate, reliable, and trustworthy.
- Dr Van K. Tharp – Trade Your Way to Financial Freedom https://www.amazon.com/Trade-Your-Way-Financial-Freedom/
- Turtle Traders – Turtle Trader Rules https://www.turtletrader.com/rules/
- Jack D. Schwager – The New Market Wizards: Conversations with America’s Top Traders https://www.wob.com/en-au/books/jack-d-schwager/new-market-wizards/


