


Now you have built your trading system, you need to monitor its performance.
There are entire books dedicated to assessing the performance of a trading system.
However, in my experience, there is no single metric that can be universally relied upon to tell you how well your system is performing.
Rather, it’s best to keep an eye on a few simple things, starting with how well your system is meeting the objectives that you set for it.
In this lesson, I will provide a practical approach to monitoring your system that you can use without dedicating a great deal of time.
Then, I’ll take you through what to consider when making changes to the system to improve it.
How to monitor your trading system
You can monitor the health of your trading system by keeping an eye on a few key metrics.
These include:
- Your returns
- Drawdowns
- Win rate
- Risk/reward
- Expectancy
- Efficiency
These metrics are easy to track and calculate. To make it simple, I’ve put together a spreadsheet that you can have 100% free from inside our resource pack.
The perfect system
You are looking for a system you can trade, not a Holy Grail.
A Holy Grail trading system performs exceptionally well on all metrics.
It is all too easy to get lost searching for the perfect system.
Rather what you are looking for is a system that allows you to meet your objectives and, crucially, is a good fit for you.
Why is that important?
A lower-performing system you can trade without making mistakes (because it fits your psychology and lifestyle), is better than a higher-performing system that is difficult to trade.
You may not replicate the performance of Paul Tudor Jones, Ray Dalio, or other Market Wizards, but you don’t need to.
Stick to what works for you, grind out the returns, and you will end up with a much better result than trying to find the perfect system.
Keep your tracking manageable
To track your performance, you need to record your trades.
The good news is that your trading platform can do much of the heavy lifting, so you don’t need to keep all the details in a spreadsheet.
The trading platform will not include R-multiples.
I track R-multiples separately in the spreadsheet I’ve shared with you above, as I can then quickly calculate my system expectancy, win rate, and average risk/reward.
R-multiples are what you have made or lost on a trade based on your initial risk.
- If you risked $100 (1R) and your stop was hit, you would take a -1R loss
- If you risked $100 and made a $300 profit, you have made 3R
Here is an example of what tracking R-multiples looks like.


This way you can easily go back and review your trades visually.
Is your system meeting your objectives?
Once you have recorded some trades, the first step in assessing your system’s performance is to ask if it’s meeting your objectives.
There is an important caveat to this.
You need to make sure that you have enough trades under your belt to make an accurate decision.
This can be the hardest part for many traders.
They give up or change their rules without enough data, based on recent trades.
This is called recency bias, and you must carefully guard against it.
You need to place between 20 and 100 trades before you get a picture.
From a statistical perspective, 20 trades would not be enough, but as retail traders, it’s ok to take smaller steps.
Once you have enough trades, you can compare your system performance to your objectives in a few different ways.
Return
You can start with return objectives. For return objectives, I suggest tracking them in two ways:
- Return as a percentage: For example, your system has made a 20% return
- Return in R-multiples: For example, your system has made 20R
Drawdown
Next, you monitor your drawdowns, or the maximum loss your system has.
You will also monitor this in both percentage terms, and R-multiples:
- Drawdown as a percentage: For example, your system had a 15% drawdown
- Drawdown in R-multiples: For example, your system had a 15% drawdown
You can then look at this over relevant timeframes:
- Daily
- Weekly
- Monthly
- Yearly
At a minimum, you should track monthly and yearly returns, and drawdowns.
Win rate
Win rate calculates how many winners you have compared to losers.
Remember a higher win rate does not necessarily mean a better trading system.
What is more important is how much you make on winning trades, compared to how much you lose on losing trades.
If you are very good at cutting your losses short and letting your winning trades run, then you will have a low win rate – and that’s fine.
In this step, you can also calculate the number of breakeven trades.
Risk/Reward Ratio
This is how much you make on average compared to how much you lose.
This can be calculated easily, by totalling up the R-multiples on your winning trades, and dividing it by the number of winning trades, ie:
total R on winning trades/number of winning trades
Much of your efforts should be towards improving this metric.
Number of trades
Here you track the number of trades over a time period, such as a week or a month.
A system can easily miss its objectives by trading too much (over-trading) or not generating enough trades for the period.
Check and ensure that the number of trades is close to your planned amount.

Ranking performance with expectancy
In Lesson #3, we covered expectancy. This is how much you can expect to make on average for each trade the system makes.
Expectancy is a good measure of the quality of your trading system.
It can be calculated in R-multiples, percent gain, pips, or dollars.
For example, if you place 10 trades and earn $1,000 in profit, your expectancy would be $100 ($1,000/10)
Here is a table that ranks expectancy for trading systems based on R-multiples.
I notice I have 4 trades in a row that are losers.
I can also see that I have two large winning trades of 6R and 23R.
Firstly, this should clue me in that I can expect to have several losses in a row, so I should not be concerned if that happens.
If I stop trading after two or three losses in a row, the system won’t work.
Secondly, it tells me that this system relies on a few big winning trades to generate profits (which is common for a good rules-based trading system.)
This is good to know, as it tells me to stay disciplined and not close winning trades prematurely.
Total of losses compared to winners
From a trading psychology point of view, it’s good to minimise the amount of losses you take.
This is because it’s easier for you to trade the system.
Each month, total up the total losses and total winners. I do this using R-multiples.
For example, you may have
- 0.8R in losses
- 20R in winners
I will then total up the average winner and the average loser.
In the above example, if there were 20 trades with a 50% win rate, this would be:
- Avg loser is 0.8R
- Avg winner is 2R
These metrics give more insight into how the system works.
Performance in market types
Next, you can track the performance of your system in different market types.
There are 8 different market types that I will track:
- Sideways quiet
- Sideways normal
- Sideways volatile
- Bull normal
- Bull volatile
- Bear normal
- Bear volatile
- Extreme
I tend to use daily market types for this, but you can choose an alternative timeframe based on your system.
You may find that your system performs well in some market types, and not others.
This is invaluable information, as not only can it clue you in as to which market types you should avoid, but which ones you can trade larger sizes in.
Note, we’ve made this process simple for you if you use our spreadsheet.
Are you making mistakes?
When you trade a system, you want to limit your trading mistakes.
It is absolutely critical that you track the impact of mistakes.
Mistakes can easily turn a winning system into a losing system, so you need to know how much they are costing.
To be very clear, a mistake is not a losing trade. In fact, a mistake could result in a winning trade!
Rather a mistake occurs when you don’t properly implement your system rules.
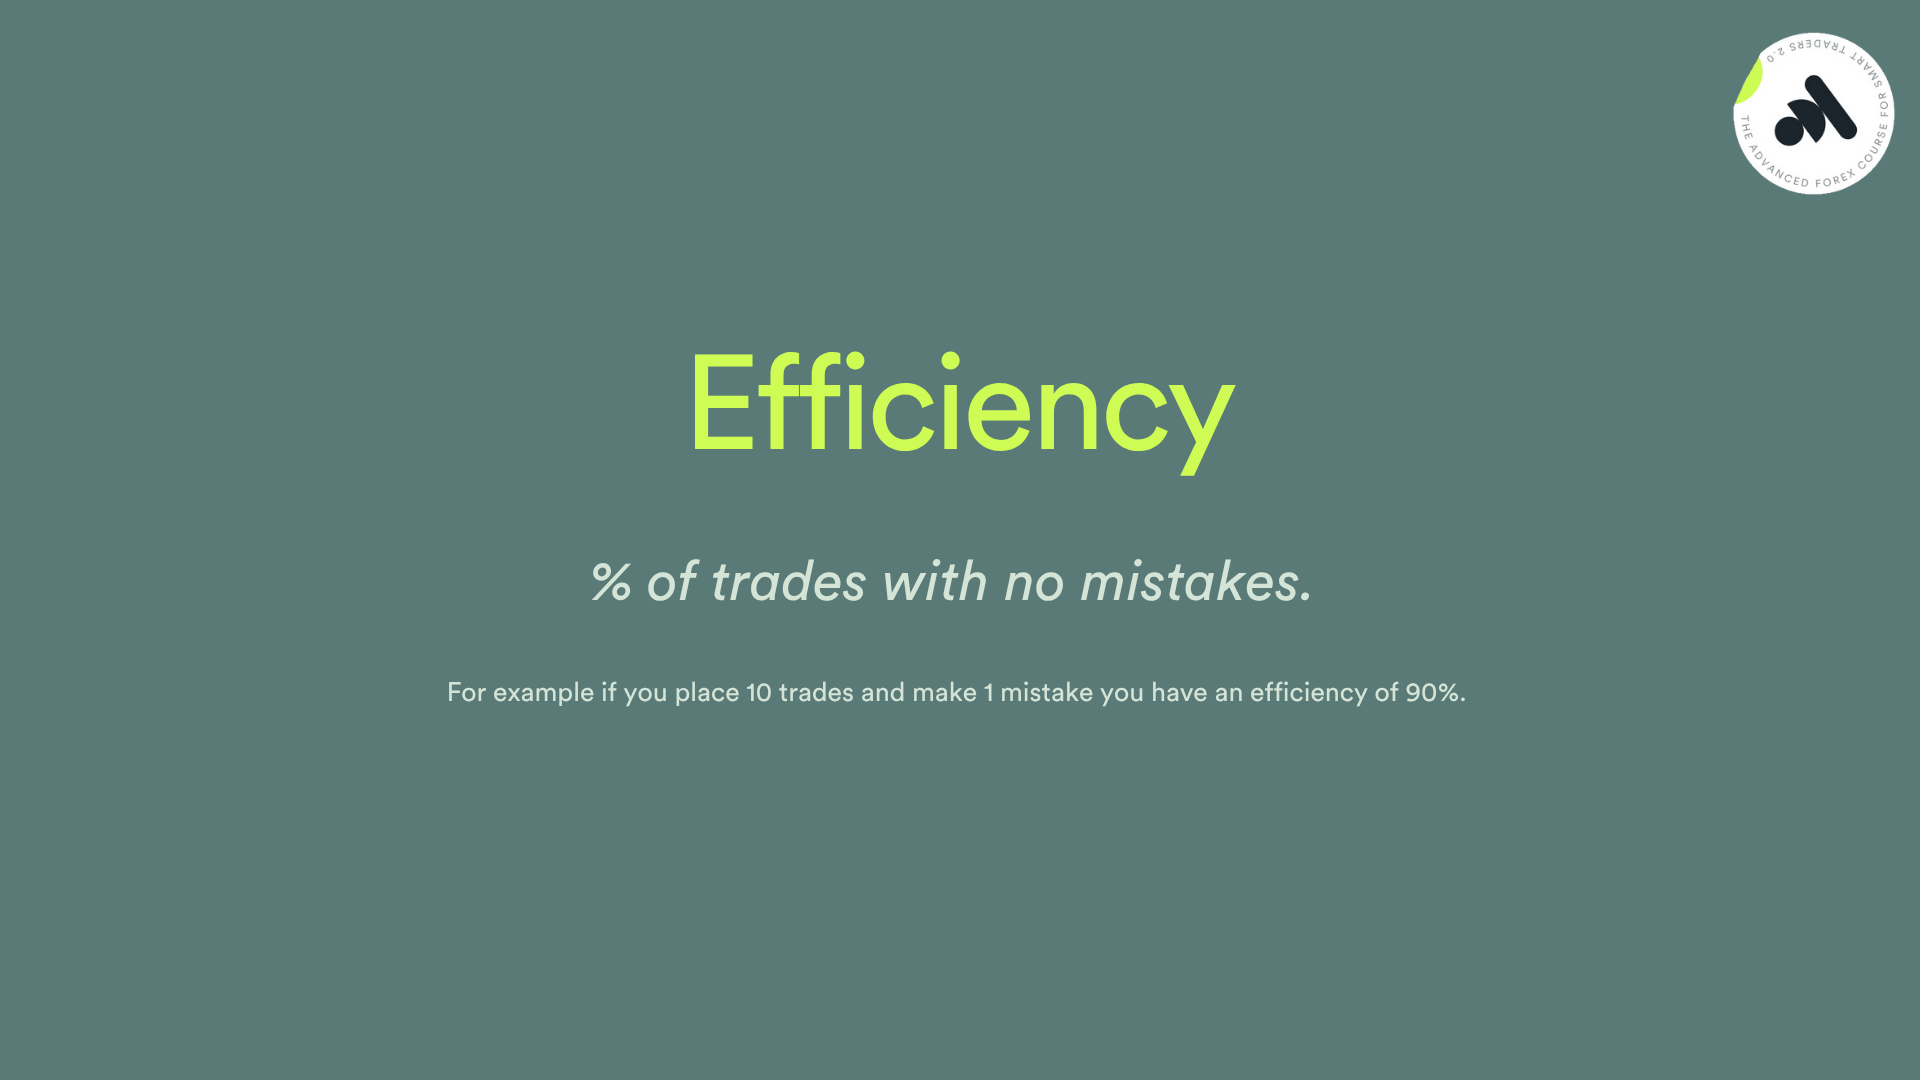
A good way to measure this is to track the system’s efficiency.
Efficiency can be expressed as a percentage. I personally like this method, as it’s simple.
Let’s say you have 10 trades.
If one of those trades is an error, your efficiency would be 90% ((10-1)/10*100).
If you placed 100 trades and made errors on 7 trades, your efficiency would be 93% ((100-7)/10*100.
You should target an efficiency above 90%.
In the above example, with the 23R trade, imagine if you made a mistake by not following your rules, and you did not place that one trade?
It would completely change the performance of your system.
If you find you are making mistakes, it may mean that the system is not a fit for you, or you need to work on your trading psychology (I cover this topic extensively later in this course).
What to do if your system is not meeting your objectives
If your system fails to meet your objectives, then you need to assess what is working (or not working.)
Ultimately, to get a better trading system, you want to do more of what is working, and less of what is not working.
You can keep trading while you do this, as long as you are staying within your risk limits.
By trading you will continue to gather more data that you can use to improve.
Remember, treat trading like a science experiment.
With experience and research, you can make changes to improve your system’s performance.
Reviewing your system performance
Here are some of the things you can review:
- Trade objective: Do you have the correct objective for your trade? For example, are you trying to capture long-term trends, or daily moves? You need to be clear about what the opportunity you are looking to capture is. Can this be more clearly defined, or do your rules need to be adjusted to create a better fit?
- The stop-loss distance. Is your stop too tight or wide?
- Your set-ups. Are your set-ups giving you an edge? Can you add a rule to filter out the poor-performing trades?
- The entry. Is your entry trigger in the right place? Is it simple and easy to implement? Can you go to a lower timeframe to improve the entry?
- The exit strategy. Are your exit rules capturing the opportunity you see in the market? Are they achieving your risk/reward target? Are you cutting your profits short? Or letting winning trades turn into losers? Are there any technical patterns that could give you an early sign that the price is about to reverse?
- Position size: Are you consistently risking the same amount? Are you trading too large or small compared to the objectives you have set? (More on this below.)
- Number of trades: Are you placing too many trades, or not enough to hit your objectives?
- The impact of news events. Is it better to close trades prior to news events or not? What is the impact of holding trades during news events?
- Time of day or week. Are there certain times of the day or week when your system performs better? Is it better to enter during certain trading sessions? Are your profits reversing when a session closes or opens? Should you avoid trading on Monday mornings or Friday afternoons?
- Higher timeframe trend or market type: What happens if you only place trades in line with a higher timeframe trend? For example, if you only buy on the daily chart during weekly bull market types?
- Bond and stock markets. What are the bond and stock markets doing during your trades. For example, are you holding risk-on positions when stocks are falling, or selling US on days where US bond yields are rising? You may find correlations that help or hinder your trades.
As you can see, there are many things to examine!
But it does not need to be all done at once.
Start simple, then repeat
Changing too many things at one time can be overwhelming and counter-productive, as it can be difficult to tell if the changes are working.
It is better to start with a simple set of rules, and make a slow but steady number of changes.
I’d suggest you take a step-by-step approach, where you examine one element of your rules-based plan at a time.
Here is an example structure, where you focus your research on a different element each month.
Following a process like this will allow you to continue to improve your trading system without trying to do too much at once.
This takes patience and discipline, but remember these are two key traits of successful traders!
Backtest any proposed changes using real trades
The good thing about an approach like this is that you can review any proposed improvements to your system against real trades.
Over time you will end up with an ever-growing database of real trades that you can refer to.
The way to do this is to look at charts of your past trades and do a backtest with any proposed changes to your rules on these trades.
This follows the same process as we covered in Lesson #10 on testing your trading plan, except using your previous trades.
What happened in your trade
Another thing I like to do is to check the reasons behind the price movement on each trade.
This is a good way for you to learn more about what is driving the performance of your system.
For example, there were sharp reversals on both of these trades, on following days.


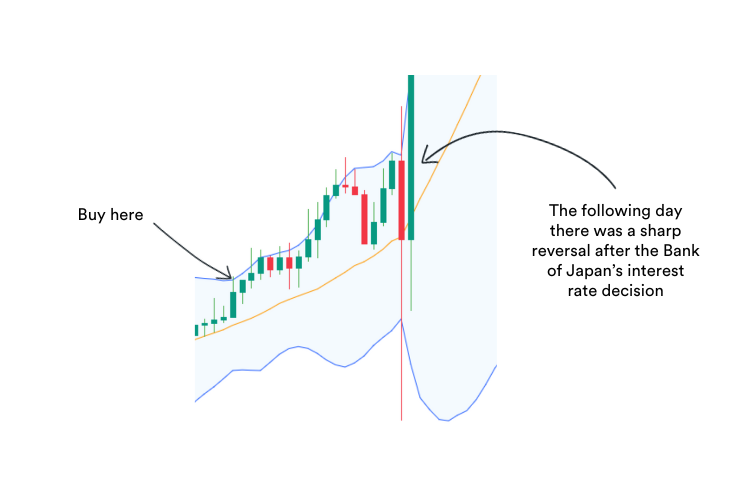
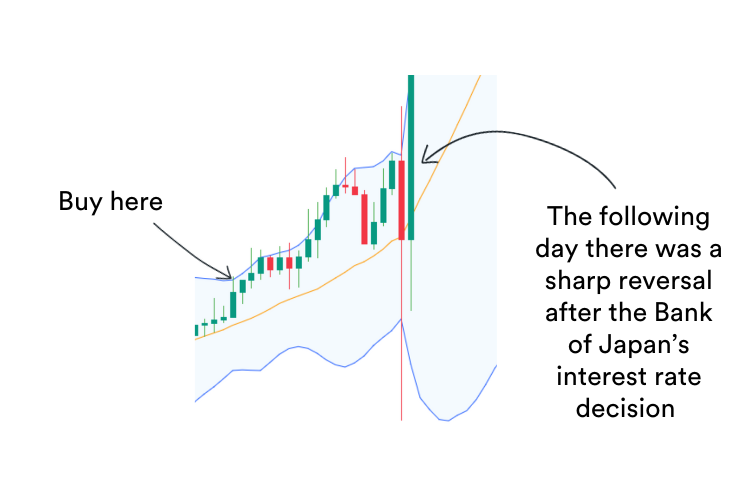
By digging deeper, you would appreciate the reversals were due to scheduled news events.
In the first case, it was US manufacturing data, followed by the Bank of Japan interest rate announcement the next day in the following example.
If you notice these types of patterns, you can add more rules into your trading strategy to avoid losses that occur during these scenarios.
Example of tweaking your system performance
Let’s look at an example of improving your performance by reviewing the position- sizing model.
Commonly, traders will need to adjust their position-sizing model after their system has been live traded for a period of time.
If you trade larger or smaller position sizes, your system’s performance could better line up with your objectives.
Now you have placed several trades, this will be easy to determine.
For example, let’s say:
- you are risking 1% of your account
- after 50 trades, you have made a 20% return in 3 months
- yet, your system has a target of 20% in a year
Perhaps you are trading too large a size?
You may be wondering why that would be a problem?
The larger you trade, the greater the returns, yet the greater the risk.
You need to be aware of this!
Market Wizards Richard Dennis and William Eckhardt experienced this when they trained a group of traders in an experiment to see if traders could be taught (the famous ‘Turtle Traders’ experiment).
After reviewing the performance of their trading strategy, the Turtles discovered that even though it was highly profitable if they continued to trade at the current position size, it could lead to a ‘risk of ruin.’
So, they immediately cut their trade size down to prevent this.
Your position-sizing model should match your objectives.
If it’s not, after a series of trades, then you need to review it.
The same applies to the number of trades your system generates.
Placing more or less trades may better align the performance of your system to its objectives.
Your system is your own
This lesson is focused on metrics that you can use to monitor the performance of your own system, and to learn how to make changes to improve it.
Keep things practical by focusing on how well your system meets your objectives, some simple R-multiple analysis and reviewing your past trades.
It’s critical for this process that you record every single trade.
This way every trade becomes a learning experience that will allow you to grow.
In the next lesson, we’ll take a step back from trading system development, and look at what it takes to run your trading like a business.
See you again soon.
Cheers,


