


Part 1:
Part 2:
Your rules-based forex trading plan outlines what you need to do to achieve your trading objectives.
It is your ultimate rule-book for every trading decision you make. This includes:
- What assets or instruments to trade
- How much to trade
- What a low-risk/high-reward trade looks like
- When to enter
- When to take a loss
- When to take profits
On top of this, it includes additional risk management rules, tells you how to handle news events, and when you can use discretion to ‘over-rule’ your rules.
In this lesson, we’ll go through the steps to create your first set of rules.
We’ll then cover how to backtest them in a simple way using a spreadsheet – with no coding required.
Think of it like learning a game
When you first learn the rules of a game, no matter how many times you study them, your approach will be different after playing the first game.
It will be different again, after playing the first ten times and different again after playing one hundred times.
This is the same with trading. Your first set of rules will get you started. You’ll then adjust them after the backtesting process.
Later when you begin to live trade, your rules will change again.
Don’t expect to solve trading the first time following this process; these rules are here to get you started.
In a future lesson, you will learn more about how to analyse your performance and improve your rules.
Small steps lead to big results!
Writing your plan
In this section, I’ll break down each part of our trading plan template.
Throughout, I’ll include an example based on my own plan, and some additional tips for you.
My tips are based on what I have seen work. They will help you keep things simple – but that’s not to say they are the only way to do things.
Ultimately, you need to follow your own light to be successful in the markets.
Note: These rules are different to the example rules from earlier in the course. I’ve recently moved countries and time zones, so I’m building a new system which I’m using here instead.
Using discretion in a rules-based trading plan
Discretion could be taking a trade, not taking a trade or closing out a trade, outside of the rules you have written in your plan.
Discretion is not a bad thing, in-fact it can be quite positive as it allows you to express your intuition about the markets.
But you want to be clear about in what scenarios it’s appropriate to use discretion. You don’t want discretion to be an excuse to not follow your rules.
Ideally you can include in your rules-based plan when you can use discretion.
I suggest benchmarking any time you use discretion. This means keeping track about whether your discretionary decisions helps or hinder the performance of your system.
You can to this by tracking the returns based on following your rules, compared to when you make a discretionary decision to close a trade, or not take a trade etc.
If your returns from your discretionary decisions improve your performance then keep doing it! If not then it may be best to just follow your rules.
System Overview
In this section, include your name, the name of your system and a summary of the system. You could start this with the statement “The objective of this system is to…” and then include how long the trades will be held and the targeted risk/reward ratio.
System overview example:
| System Overview | |
|---|---|
Your name | Sam Eder |
The trading system’s name | USD/JPY Low Volatility Breakouts |
Summary | The objective is to day trade breakouts from periods of low volatility on USD/JPY. |
The Opportunity
Here you will describe the opportunity you have designed this system to trade. For a rule-based trading system, you want something repeatable.
For forex traders this could be trading a particular session or news event. Alternatively, it could be a set of chart patterns you have identified.
We all see the markets differently, so the answers here will be broad in scope. What is important is coming up with a clear description that defines the opportunity. Keep it simple.
Opportunity example:
| Opportunity | |
|---|---|
Describe the trading opportunity you have identified: | After the US markets close, the price will often settle into a sideways quiet market type. As traders come online through the day, starting with Japan, there are breakouts on USD/JPY that lead to good risk/reward trades. |
Trading capital
Write down how much trading capital you will allocate to this strategy. In my time working for brokers, I saw many traders fail because they did not have enough capital in their accounts for the positions they were taking.
Unbelievably, around 30% of accounts would have margin closeouts.
Being properly capitalised is one of the keys to staying in the game.
The good thing about being a rules-based trader is that you will always be very clear on your risk – and your risk is only a fraction of your account, such as 1% per trade.
Remember in the lesson on position sizing, we talked about reducing your trading size even further when you first start, to as low as 0.2%? This keeps you going while you test and refine your strategy (this is in the position sizing model section below).
Trading capital example:
| Trading Capital | |
|---|---|
How much capital will you allocate to this trading system? | $100,000 |
Instruments
Another common mistake is traders taking positions on several instruments at the same time. This, combined with being under-capitalised, is a recipe for disaster.
In my trading, I cut back to trading only USD/JPY. This keeps my head clear when making trading decisions.
If you are day trading, I’d advise sticking to one instrument. For swing traders, you can expand to three or four. For position traders, limit yourself to 10 markets at maximum.
As you gain experience with a rules-based system, you will realise that you only need one good trade a week to hit your goals.
This is not quite what Warren Buffet said about one good investment a year was enough, but you get the picture!
Instruments example:
| Instruments | |
|---|---|
What instruments will you trade with this system? | USD/JPY |
Market types
Your system should be designed to work in one or two market types. Don’t search for the holy grail system that works in every market type.
In this section, you’ll refer to the market type for your main trading timeframe. For example, I trade on the 15-minute chart and look at the daily chart when conducting market analysis.
Here I note the market type for the 15-minute chart. You can also consider higher-timeframe market types.
Market type example:
| Market type | |
|---|---|
What market types will this system be used in? | Sideways quiet market type |
System objectives
Here you will list your System objectives from Lesson 4.
Remember that these objectives are your targets, not what you have achieved so far.
You don’t need to shoot for the moon. Consistent returns with limited drawdowns will compound over the long term.
System objectives example:
| System objectives | |
|---|---|
Return target | 3% a month |
Maximum drawdown target | 3% a month |
Trading opportunities | 20 – 30 a month |
Risk/reward target | 1:3 |
Win rate target | 50% |
Position-sizing model
Your position-sizing model answers the question ‘how much to trade.’
How much you trade ultimately determines if you meet your objectives.
If you trade too small or too large (or too often), you’ll trigger your risk limits, or not make enough when you trade well.
Start by defining your 1R risk, the maximum loss on a losing trade.
You can also include a rule for increasing your position-size on high-conviction trades. This can be included in a later version of the plan.
As mentioned above, it’s also good to cut your position-size back further when you first start trading a new system. This will protect both your capital and your mental state!
Position-sizing model example:
| Position-sizing model | |
|---|---|
How much will you risk per trade? This is your 1R (risk) | 0.5% of my trading account |
Will you increase your trade size if you have higher conviction on a trade? | Yes, by 100% |
Will you trade a smaller amount on your ‘core’ trading capital, as opposed to any profit that you have made from your trading? | Yes, 0.2% |
Market analysis
In the market analysis step, you include your rules for identifying low-risk/high-reward trading opportunities i.e. those where you have a superior risk/reward ratio such as 1:3.
Your market analysis can cover both fundamental and technical factors. It includes both higher timeframe analysis and conditions you want to see on the chart timeframe you are trading.
Remember this is not your entry. Your entry is the final one or two conditions that trigger you to place your order in the market.
We separate these two steps to allow for detailed analysis and decisive trading.
One way to think of this is the analyst vs the trader.
Imagine a trader at a prop firm or bank. They have an analyst who spends all their time looking for the best trading opportunities. Once they find them, they pass them to the trader to enter the trade, manage the risk and ultimately generate the profits.
In this step, you are the analyst, while in the next step, you are the trader.
Each factor used to determine the trading opportunity is called a ‘set-up.’
These ‘set-ups’ are then listed as separate rules.
Some of these rules will be detailed, but others – particularly fundamental rules – can be broader.
For example, you may say ‘needs to be in line with the macro trend.’ In this instance, you don’t need to outline how you identify the macro trend here, although you can include a summary, like I have done below for set-up rule #1.
You could also include more intuitive rules such as ‘must feel good about the trade.’
If you are using discretion in your plan like this, then make sure you clearly state when you can ‘over-rule’ your more specific rules.
Here is an example of some set-up rules. I’m using 15-minute charts.
Market analysis example:
| Market analysis | |
|---|---|
Set-up-rule #1 | Long if above the daily mid Bollinger Band and short if below |
Set-up rule #2 | The Bollinger Band relative width is below 80 |
Set-up rule #3 | The Market Type indicator to signal sideways |
Set-up rule #4 | First trade after 8am and last trade before 10pm |
Set-up rule #5 | No trades if USD/JPY has moved 0.6% for the day |
Set-up rule #6 | No trades until 12:00pm on Monday |
Entries
In the entry step, you list your final rules that determine when or where you will place an order into the market.
This should be simple and unambiguous. If you have unclear entry rules there is a high chance of making a mistake when you have to act fast.
I include a section here on scaling-in to trades. If you have a trend-following system you may include rules for scaling in now, otherwise, this can be saved for another time.
Entries example:
| Entries | |
|---|---|
When exactly will you enter a trade? | Once all set-up conditions are met, place a stop entry order on the Bollinger Band. |
Will you scale in to an existing trade, and if so, how exactly will you scale in, when and why? | No, I won’t scale in |
Stop-losses
Next, you will list where you will place your stop-loss.
If your stop-loss is too close you will get stopped out of winning trades, yet if it is too far you will struggle to achieve your desired risk/reward ratio.
Generally, this will take a bit of testing. My advice is to keep your stop a little wider when you first trade a system so you can get a feel for how far it should be.
After a certain amount of profit, it makes sense to move the stop to breakeven. In my experience, you don’t want to do this too early as it is another way to get stopped out of winning trades. You can consider moving the stop after 2 or 3R profit.
Stop-losses example:
| Stop loss | |
|---|---|
Where will you place your stop-loss? | 1.5 x the Average True Range (ATR) |
Will you move your stop-loss to breakeven, and if so, when? | Yes, after 3R profit |
Exits
Your exit rules list the different scenarios where you will close out of some or all of your trade.
A good set of exit rules can be complex as you need to:
- Adapt to changing market conditions
- Let your profits run, yet;
- Take profits when the market makes them available
They also need to achieve your risk/reward ratio goals.
You can consider having exit rules for:
- Hitting your target
- Capturing big moves
- Overbought or oversold conditions
- Fast moving markets
- Obvious reversal patterns
- News events
- Time of day
- When the price gets close to your target and starts to reverse
- Protecting profits with a trailing stop
- When you expect a long-term trend
You want to break your trade into three to five parts each with different rules. You can think about them like this:
- One part is when you have a decent amount of profit, this can be your first target
- One part is when the market gets overbought or oversold and reverses. You may have a second target on this part
- One part to capture the trend. This part is normally left to run on the trailing stop. Profits can be taken if the market gets overbought or oversold and is deeply in profit
- One part that is left to run just in case there is a huge trend. This will be a small part of the trade (such as 10%)
In saying all this, you can add to your rules over time. A good way to start would be with three targets at say:
- 1.5 times your risk
- 3 times your risk
- 5 times your risk
Then add a trailing stop to protect your profits and a rule to exit your position if the market gets overbought or oversold and reverses.
As you get more experience with the system you can add more rules.
Exits example:
| Exits | |
|---|---|
Exit-rule #1 | Place a target at 3R on 1/3 of the position |
Exit rule #2 | Place a target at 5R on 1/3 of the position |
Exit rule #3 | If >3R in profit and the Market Type indicator is overbought/oversold and reverses then exit |
Exit rule #4 | Place a trailing stop on the Supertrend indicator with the settings 3/7 |
Exit rule #5 | Exit any open positions at the close of the New York session |
News events
News events require special consideration from forex traders, as they can be so impactful.
If you close out ahead of news events, it can mean that you lose out on potential windfall profits.
At the same time, if you are in a winning trade, your profits could quickly disappear, or you could experience slippage and take a greater than 1R loss.
Additionally, you may have a view on the news event to consider.
In this section, you will outline your approach to upcoming news events. Remember, this will not be for all news events, but rather only those that are scheduled in the calendar and expected to impact the price. We’ll cover more on this topic in the next lesson.
News events example:
| News events | |
|---|---|
What, if any, action will you take before major news events? | Close 2/3 of the trade 30 minutes prior to major news, leaving 1/3 of the original position on during the news event. |
Additional risk management rules
In this section, we include additional considerations to help you manage your risk (and profits).
- What is the maximum number of trades you will take in a set time period?
One of the main mistakes I see traders make is over-trading. One or two good trades a week is all that is required for a day trader to have a great month. Similarly, a long-term trader might require one or two good trades a quarter or even a year.
Keep a tight lid on the number of trades you place.
For the longer-term trader, or for those of you trading multiple instruments, you can also include a maximum number of open positions at any one time.
- What will you do if you hit your drawdown level?
If you hit your drawdown, it should trigger an action. For me, this would be stopping trading for the month. For others it could be reducing their trade size. This way, you will know that even in your worst month, you will only have a 3% loss.
When you are trading you want to target what is called ‘asymmetrical returns.’ This is where you have the opportunity for large gains, but limited losses.
If my maximum loss is 3% a month, but I can make 10% or more in a month, then I have created a favourable returns scenario.
This is why appropriately managing drawdowns is so important.
- Will you reduce your position size if a % of your drawdown level is hit?
Another way to handle drawdowns is to reduce your trade size before the drawdown threshold is reached. This, of course, will make it more difficult for the drawdown level to be reached.
This is not always a good idea, as by reducing your position size, you are not making as much on winning trades – making it harder for you to recover from the drawdown.
- What will you do if you hit your daily, weekly or monthly targets?
Managing profits is just as important as managing losses. You don’t want to turn a winning day or month into a losing month by over-trading.
Conversely, a good start to the day or month could give you the opportunity to go for a really big winning day or month – where you generate those asymmetrical returns I was talking about.
For me, I keep it simple and keep trading as normal. Others may choose to increase their position size and risk some of their profits to make large returns. Or they may decide to cut back or stop their trading to lock in the gain for the day or month.
- What will you do if you don’t follow your trading rules?
Mistakes kill trading systems, and tracking your mistakes is a key task you will have moving forward.
The good thing about rules-based trading is that because you have a clear set of rules, knowing you have made a mistake is easy. It’s simply not following your rules!
This is measured by tracking your efficiency. Efficiency is simple, if you make 1 mistake out of every 10 trades your efficiency is 90%, if you make 2, then it’s 80%.
Ideally, you want an efficiency of 95% or higher.
In this section of the plan list down what you will do if you notice an increasing number of mistakes. This could involve stopping trading for a week, or even the rest of the month.
We’ll cover this topic more in the next lesson.
Additional risk management rules example:
| Additional risk management | |
|---|---|
What is the maximum number of trades you will take in a set time period? | 2 per day |
What will you do if you hit your drawdown level? | Stop trading for the month |
Will you reduce your position size if a % of your drawdown level is hit? | No |
What will you do if you hit your daily, weekly or monthly targets? | Continue to trade as normal |
What will you do if you don’t follow your trading rules? | Stop trading, assess and add new processes |
Now you have put together your plan it’s time to test it!
Backtesting your plan
Backtesting is when you review previous examples and record how they performed to see how well your rules worked in the past.
While backtesting can be done by a computer program, that requires coding in your rules, and determining if the computer has tested the rules correctly, and that the data used to test the rules was accurate data.
Rather, we will use a simple approach to backtesting by reviewing the charts and using a spreadsheet.
First, let’s discuss some of the pitfalls of backtesting.
Watch out for bias and curve-fitting
When you review previous charts, it’s easy to see lots of profitable trades!
Because of this, you could tend to ‘fit’ your rules to these trades. Of course, future trades may not match trades that have happened in the past. This is called curve fitting.
Additionally, being human, we see what we want to see. For example, you may look at a chart and only see the winning trades, but miss some of the losing trades. This is called bias.
To guard against these challenges:
- Don’t change indicator settings to fit past markets
- Make sure you are not using ‘future’ information when checking your rules. You can do this by moving the charts so you can only see what happened before the trade
- Take a break and check again
- Make sure your test covers 100+ examples
- Test random time periods (such as three months, two years ago), not only recent results
- Test other markets that you are not trading. This can help you determine how universal your rules are
- Remember spreads widen around news, and there is often slippage, so it’s very hard to accurately backtest a news trading strategy
Bias and curve-fitting are why it’s important not to rely on backtesting solely.
When you live trade you will record your results and have a bank of past trades you can review.
The backtesting process
When you backtest, you are testing your entry, stop-loss and exit rules.
To do this you open up a chart and then measure how many R-multiples you made from the trade.
You record this in a spreadsheet for each trade and then add up the total at the end to see how many R-multiples the system has made. See below for practical examples of how this works.
Let’s look at an example of a backtest of five days’ trading. I’ve used the rules set above with a simple 200-period EMA to represent the daily direction.
The initial back-test is very simple, with only the stop and the 3R target.
For those of you unfamiliar with using your charting program to backtest trades, I am using the ‘projection drawing’ facility in TradingView to record my trades.
The start of the green portion of this tool shows the entry point, and the red portion shows where the stop loss is.
This diagram shows you how to mark up your charts.


Over this period there were 6 trades, with one day with no trades.
Day one
There were two trades on day one, a loser costing -1R and a winner making 3R.


We record them in our spreadsheet like this:
| Backtesting spreadsheet | Winners | Losers |
|---|---|---|
Trade #1 | +3 | |
Trade #2 | -1 | |
Day two
On day two there was no trade, but there was an opportunity that our system did not capture.
We can think about if we could adjust our rules to capture scenarios like this, and save that idea for a future back-test.


Day three
On day three there was a losing trade costing -1R, where we were quickly stopped out.


These trades can be added to our spreadsheet.
| Backtesting spreadsheet | Winners | Losers |
|---|---|---|
Trade #1 | +3 | |
Trade #2 | -1 | |
Trade #3 | -1 |
Day four
On day four we had another losing trade for a -1R loss.


This is entered into our spreadsheet.
| Backtesting spreadsheet | Winners | Losers |
|---|---|---|
Trade #1 | +3 | |
Trade #2 | -1 | |
Trade #3 | -1 | |
Trade #4 | -1 |
Day five
On day five we had two trades: a -1R loss and a 3R winner. We note that by having a fixed target at 3R we only captured a small part of the trade.
We can consider leaving a portion of the trade to run in a future test.


We add these two trades to our spreadsheet.
| Backtesting spreadsheet | Winners | Losers |
|---|---|---|
Trade #1 | +3 | |
Trade #2 | -1 | |
Trade #3 | -1 | |
Trade #4 | -1 | |
Trade #5 | -1 | |
Trade #6 | +3 |
Let’s check some metrics from our test.
| Backtesting spreadsheet | |
|---|---|
Profit in R (The sum in R of all trades) | +2R |
Avg profit in R (expectancy) (This is the profit in R divided by the number of trades) | 0.33R |
Avg winner (Total R profit on winners divided by the number of winners) | +3R |
Avg loser (Total R losses on losers divided by the number of losers) | -1R |
Average risk/reward ratio (This is the average winner divided by the average loser) | 1:3 |
Win rate (expectancy) (This is the total number of trades divided by the number of winners, times 100) | 33% |
Comparing results
I can now compare these results against my system objectives.
- Firstly, it’s profitable, which is good, and 2R a week risking 0.5% per trade would hit my monthly goal of 3%!
- The risk/reward ratio of my winning trades is 3, which is what I am after
- The win rate is lower than my 50% target.
The expectancy is also low at 0.33. I would like this to be 0.5 or higher (more on this in Lesson #12).
Adding a trailing-stop
Now I’ll move on to the second part of the test. Let’s see what happens if I add a trailing stop on the Supertrend indicator with the standard settings of 3 and 7.
This impacts two trades, turning one from a 1R loss into a 0.3R winner and reducing the loss on another one to a 0.5R loss.
Here they are on the charts.
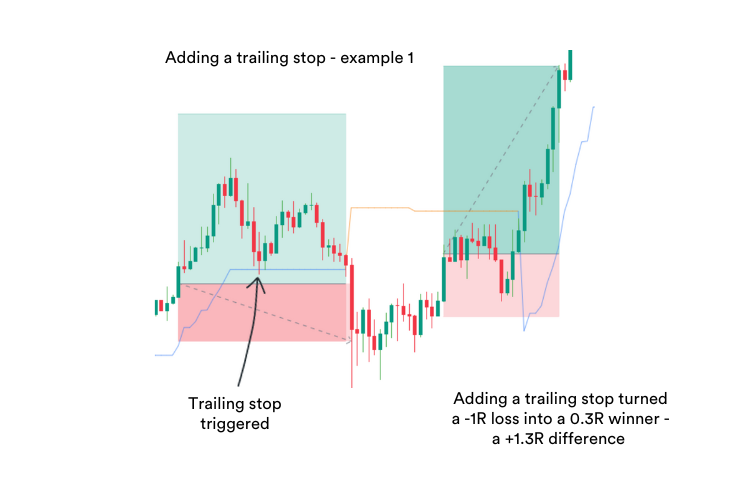


We can now update our spreadsheet:
| Backtesting spreadsheet | Winners | Losers |
|---|---|---|
Trade #1 | +3 | |
Trade #2 | +0.3 | |
Trade #3 | -0.5 | |
Trade #4 | -1 | |
Trade #5 | -1 | |
Trade #6 | +3 |
And here are the new metrics:
| Backtesting spreadsheet | |
|---|---|
Profit in R (The sum in R of all trades) | +3.8R |
Avg profit in R (expectancy) (This is the profit in R divided by the number of trades) | 0.63R |
Avg winner (Total R profit on winners divided by the number of winners) | +2.1R |
Avg loser (Total R losses on losers divided by the number of losers) | -0.83R |
Risk/reward ratio (This is the average winner divided by the average loser) | 1:2.53 |
Win rate (This is the total number of trades divided by the number of winners, times 100) | 50% |
We have now improved the system with greater overall profits, expectancy above 0.5, smaller losses and a higher win rate. The average risk/reward has dropped due to the inclusion of a small winner.
This process can then be repeated with other proposed rules. Next, we might look at what happens if we leave part of the position to run.
Of course, this is a simplified example and we would look at a much greater number of trades for our backtest.
Backtesting in action
If you want to see more backtesting in practice, here’s a video of me doing lots of backtesting.
Spreadsheet time!
Now you have both a plan and a method of testing it.
It’s time to get out your spreadsheets and get busy!
I would suggest that you keep it simple to begin with, and don’t spend too much time before beginning some controlled live trading (which is the topic of our next lesson).
In saying that, make sure you test 100 trades at least a few times. Once you get into the swing of it, you will find you can do this quite quickly.
If you have any questions let me know.
In the next lesson, I’ll share with you tips to avoid making mistakes when you live trade.
Cheers,

Sources
Marketmates uses only high-quality sources, including peer-reviewed studies, to support the facts within our articles. Read our editorial guidelines to learn more about how we fact-check and keep our content accurate, reliable, and trustworthy.
- Dr Van K. Tharp – Trade Your Way to Financial Freedom https://www.amazon.com/Trade-Your-Way-Financial-Freedom/
- Turtle Traders – Turtle Trader Rules https://www.turtletrader.com/rules/
- Jack D. Schwager – The New Market Wizards: Conversations with America’s Top Traders https://www.wob.com/en-au/books/jack-d-schwager/new-market-wizards/


